59% of marketers feel increased pressure to prove the value of marketing to their CEOs. Yet, only 55% of marketers consistently measure marketing effectiveness.(CMO Survey August 2021)
Why aren't 100% of marketers measuring their ROI or other key metrics? Why aren't 100% of CEOs demanding greater accountability? In my experience, it's because marketers and CEOs A) don't speak the same language, and B) don't even know what questions to ask to get on the same page.
We need greater alignment on the metrics that matter to a business.
The solution? An investment in attribution.
Marketing attribution is the way in which marketers assess the value or ROI of the channels that connect them to potential customers. In other words, it's measuring the means by which the customer came to know and buy your product or service.
Attribution is hard and often oversold as a perfect "closed loop" view of your entire customer journey. There is an endless parade of software platforms, CRMs, analytics packages, consultants, and gurus claiming to be able to measure your marketing ROI and channel attribution to the penny.
But it's just not within reach for most marketers. We advise starting with what you have and layering in more precise attribution tools as your needs become clear.
Most marketers have access to Google Analytics (GA) as a starting point. Here are 4 pre-built reports that will help you justify marketing spend across multiple channels. The good news? These are already available in your Google Analytics account.
Multi-Channel Funnels Reports
The Multi-Channel Funnels reports section of GA never gets much love. Didn’t know they existed? Now you do…and they could be your secret to better ROI. These reports are enabled by default if you are already tracking conversions (leads, sales, etc.) in Universal Analytics.
How does the report work? GA automatically groups all of your traffic sources into channels. It’s not perfect but is customizable. When a visitor completes a goal, GA can look back at the traffic sources that contributed to the conversion.
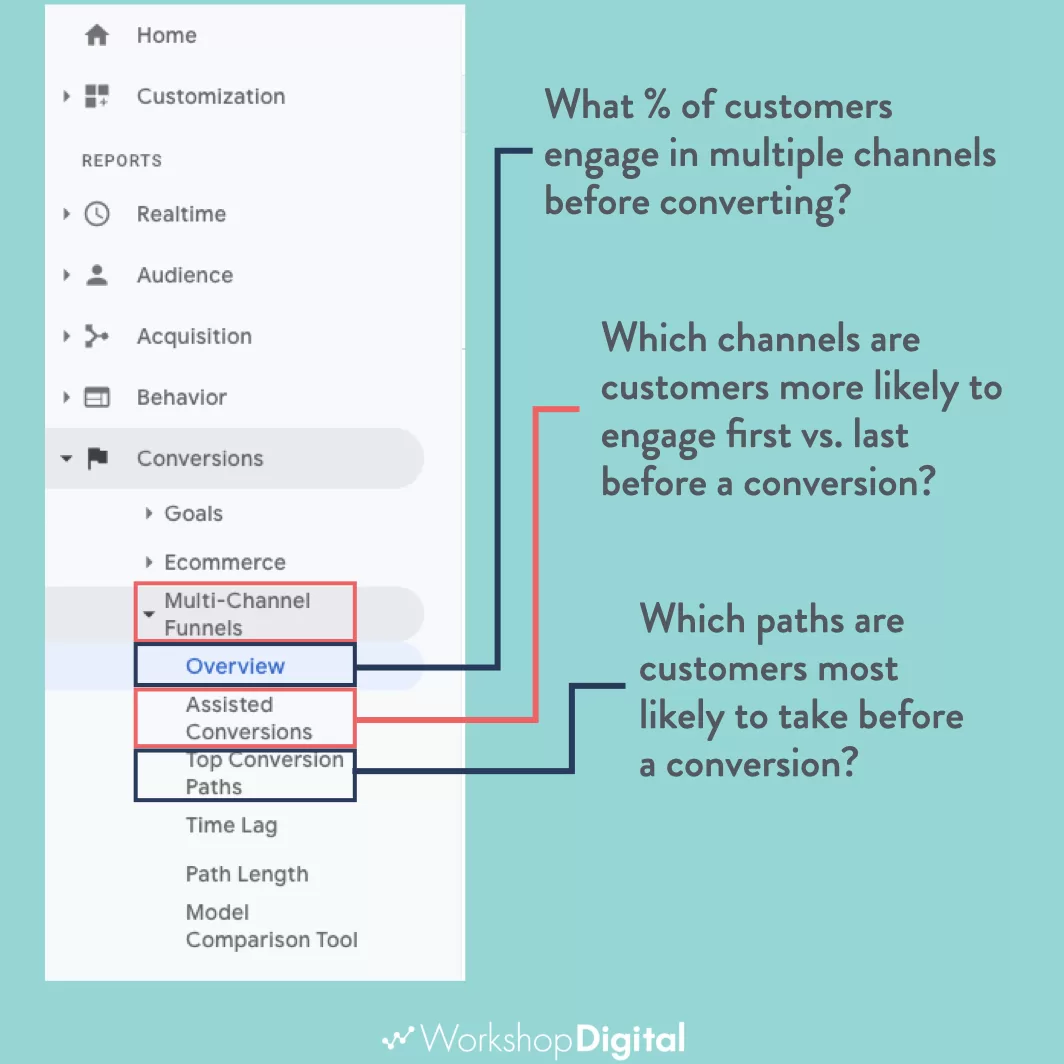
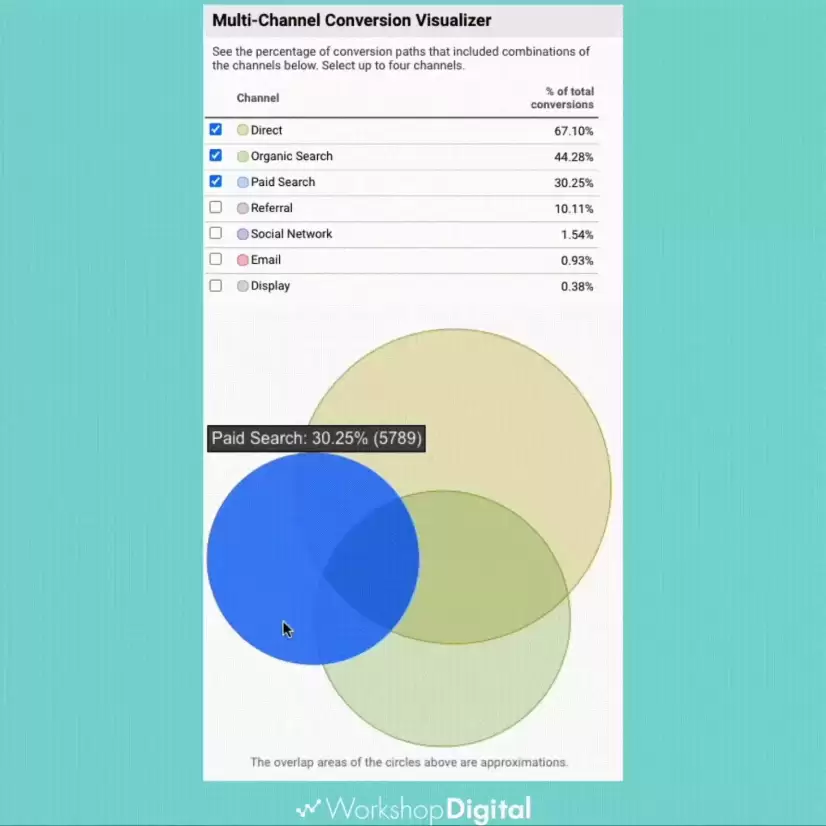
Multi-Channel Funnels Overview Report
The Overview report shows overlaps between channels and answers the question, “What % of customers engage in multiple channels before converting?” The venn diagram doesn’t go deep enough, so the next report is much more useful…
Assisted Conversions Report
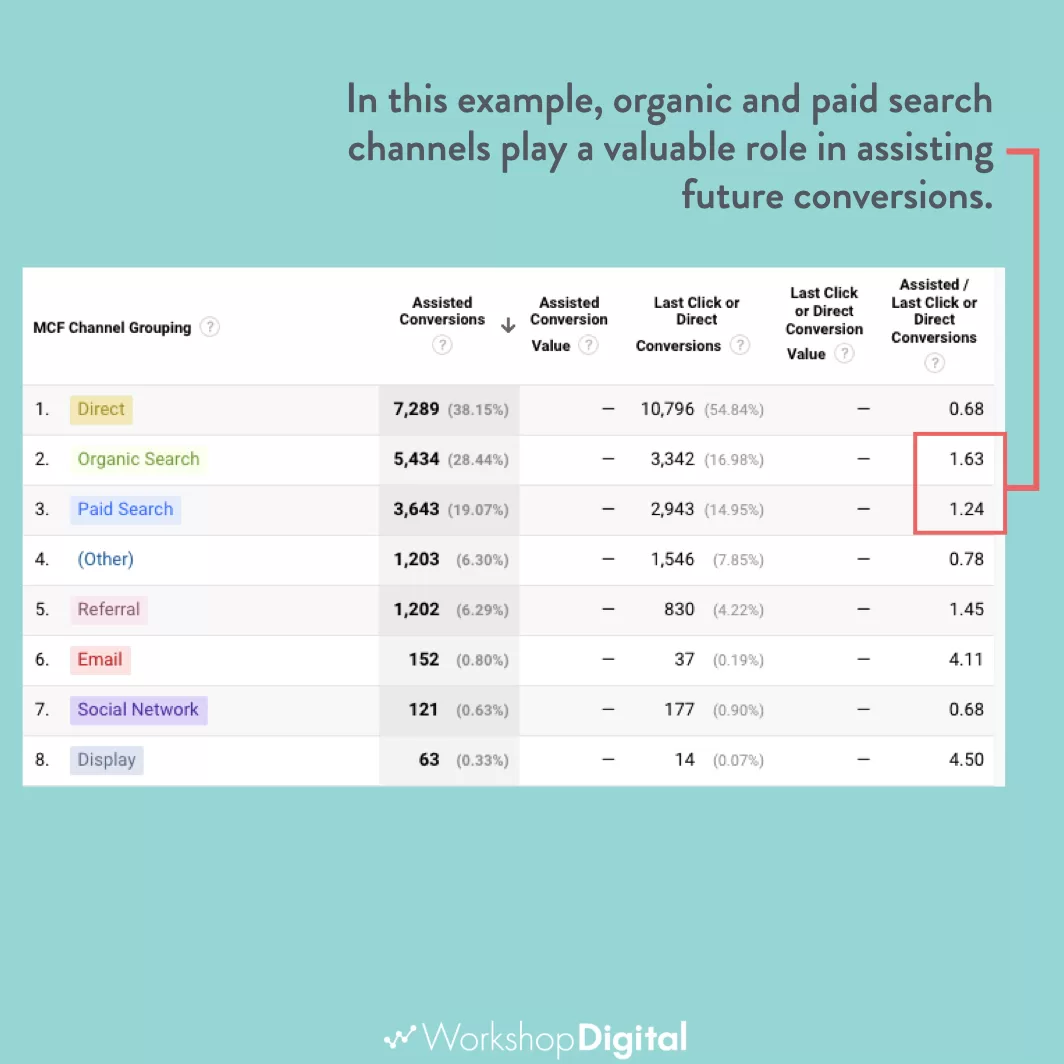
The Assisted Conversions report shows each channel’s contribution to conversions and whether they are more likely to capture a conversion (last click) or influence a future conversion (assisted). Pay attention to the ratio of assisted to last click conversions for each channel.
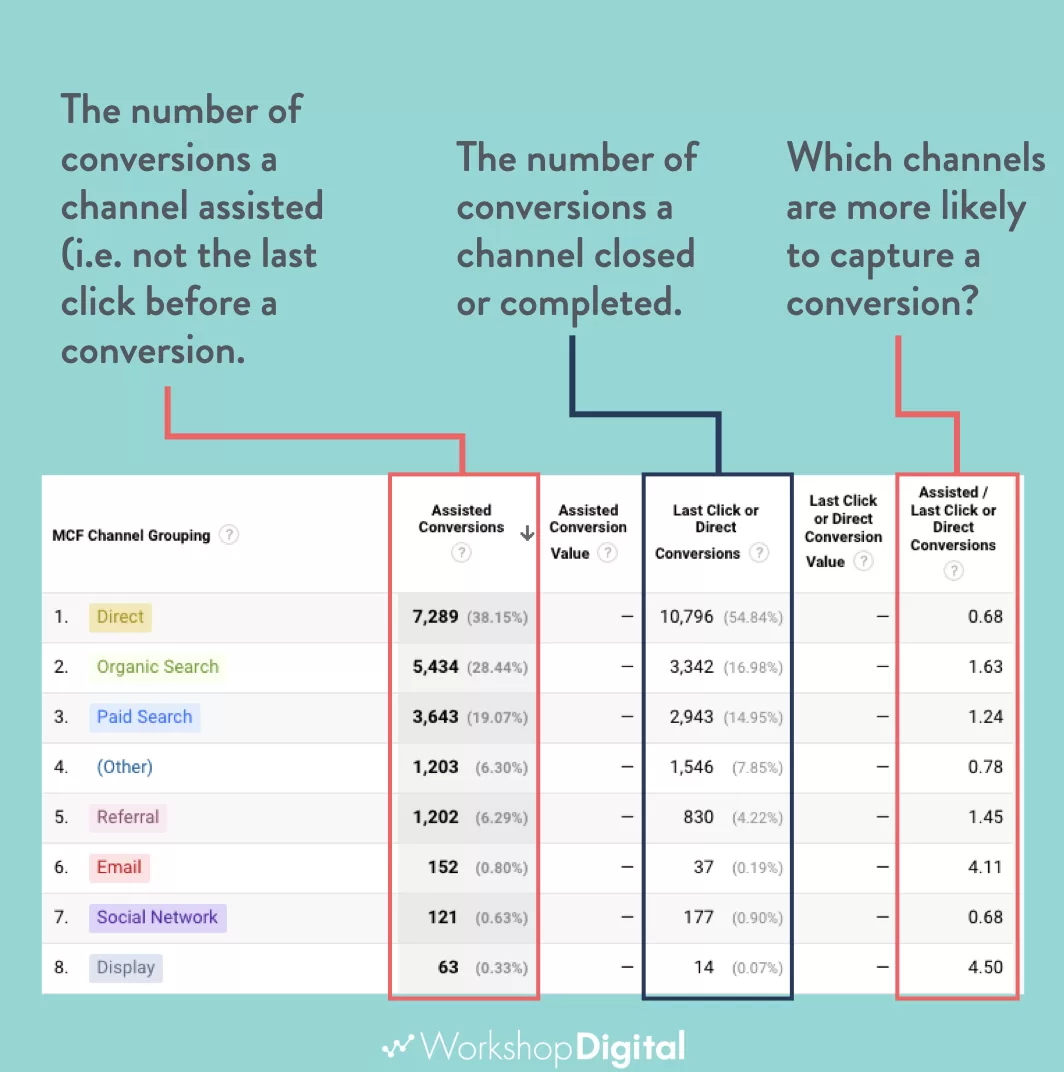
Pro tip: Last click attribution ignores valuable touch points early in the customer journey.
Use Assisted Conversions to determine downstream impact of awareness and social channels. They may assist more conversions than you expect. Cutting them off can hurt future performance.
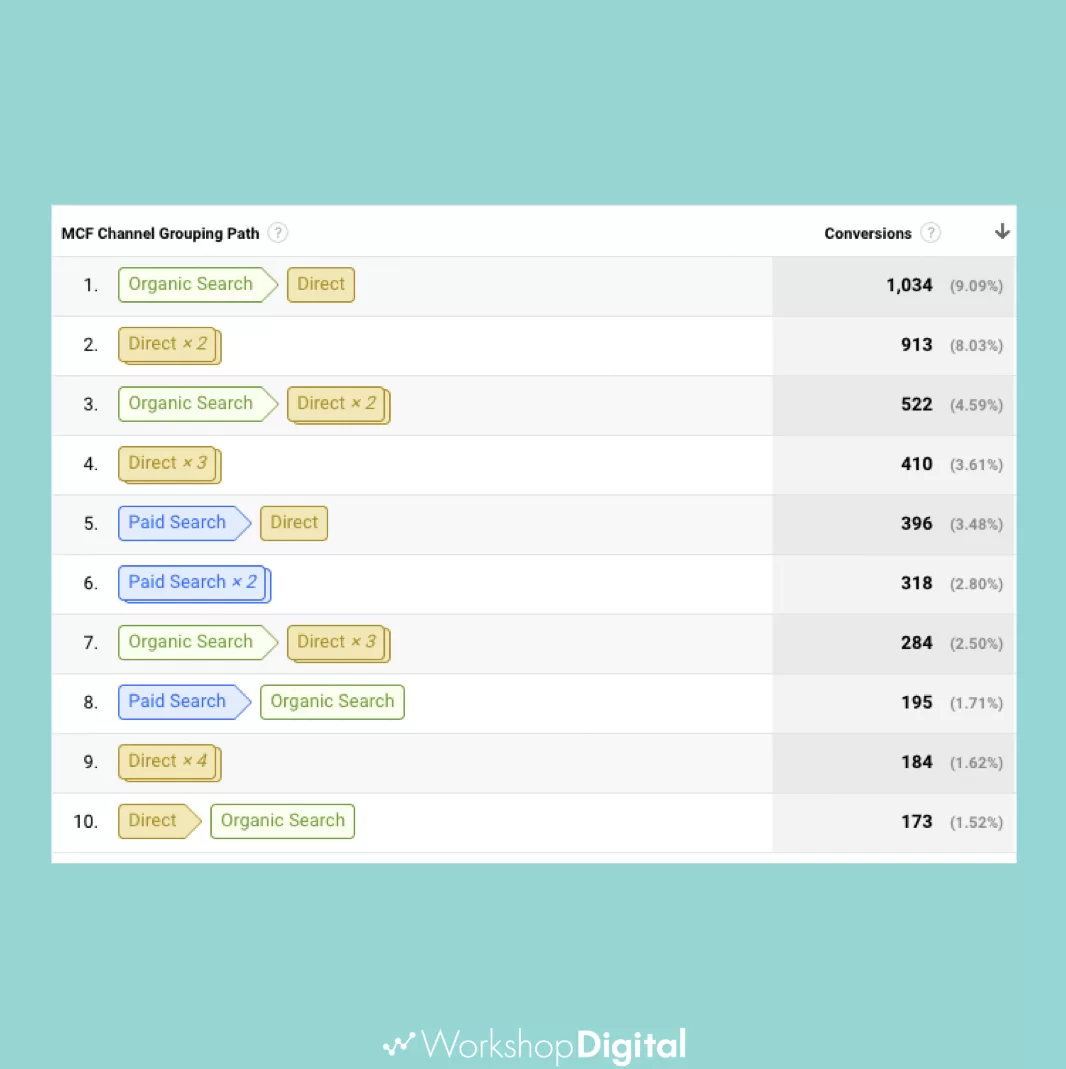
Top Conversion Paths Report
The Top Conversion Paths report shows the unique paths that led to conversions. It’s not super actionable, other than pointing out the long tail of conversion paths. In this example, the 11,372 conversions came from 2,376 unique paths - there’s no “typical” customer journey!
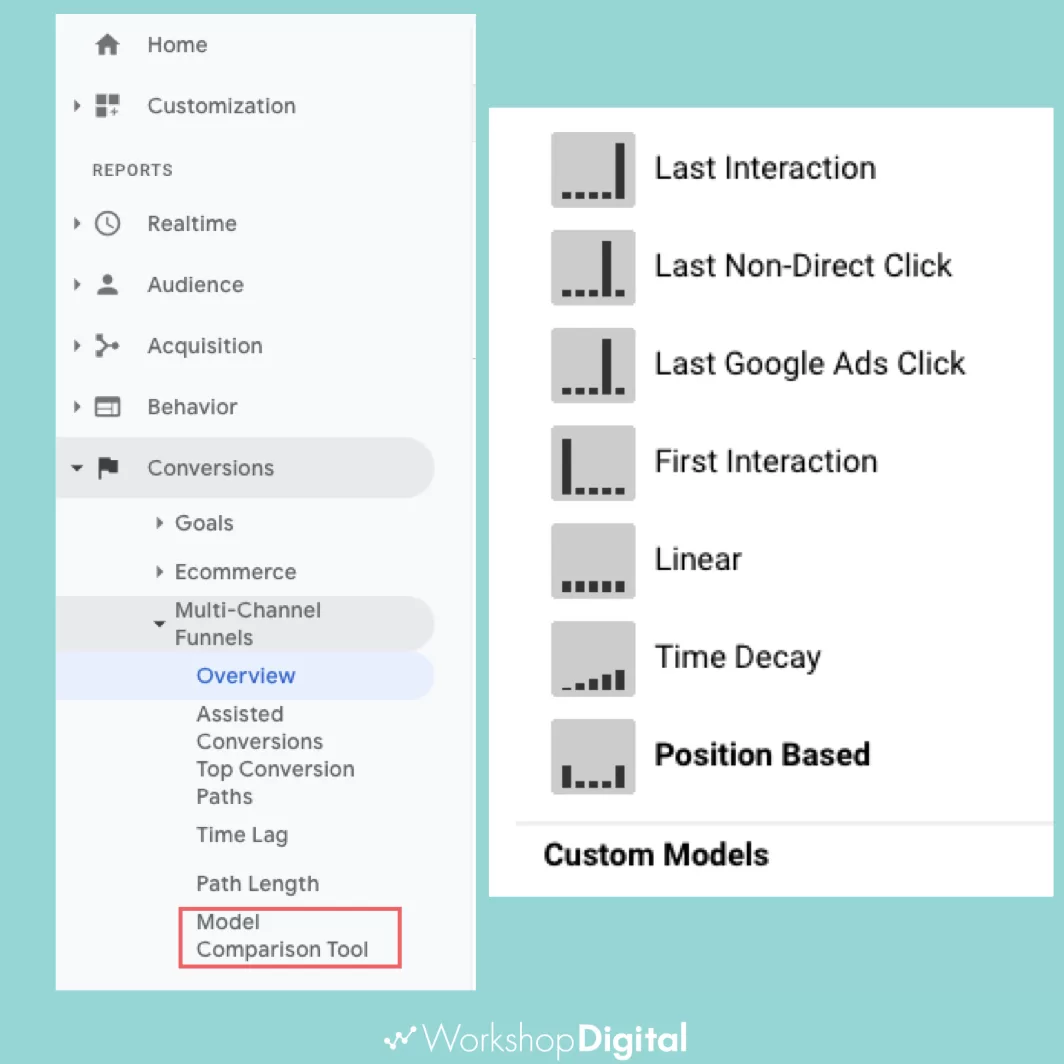
And One More…Model Comparison Tool
Bonus time! GA lets you build different attribution models to weight each step of the customer journey. There is no “right” answer — every company and customer have different paths.
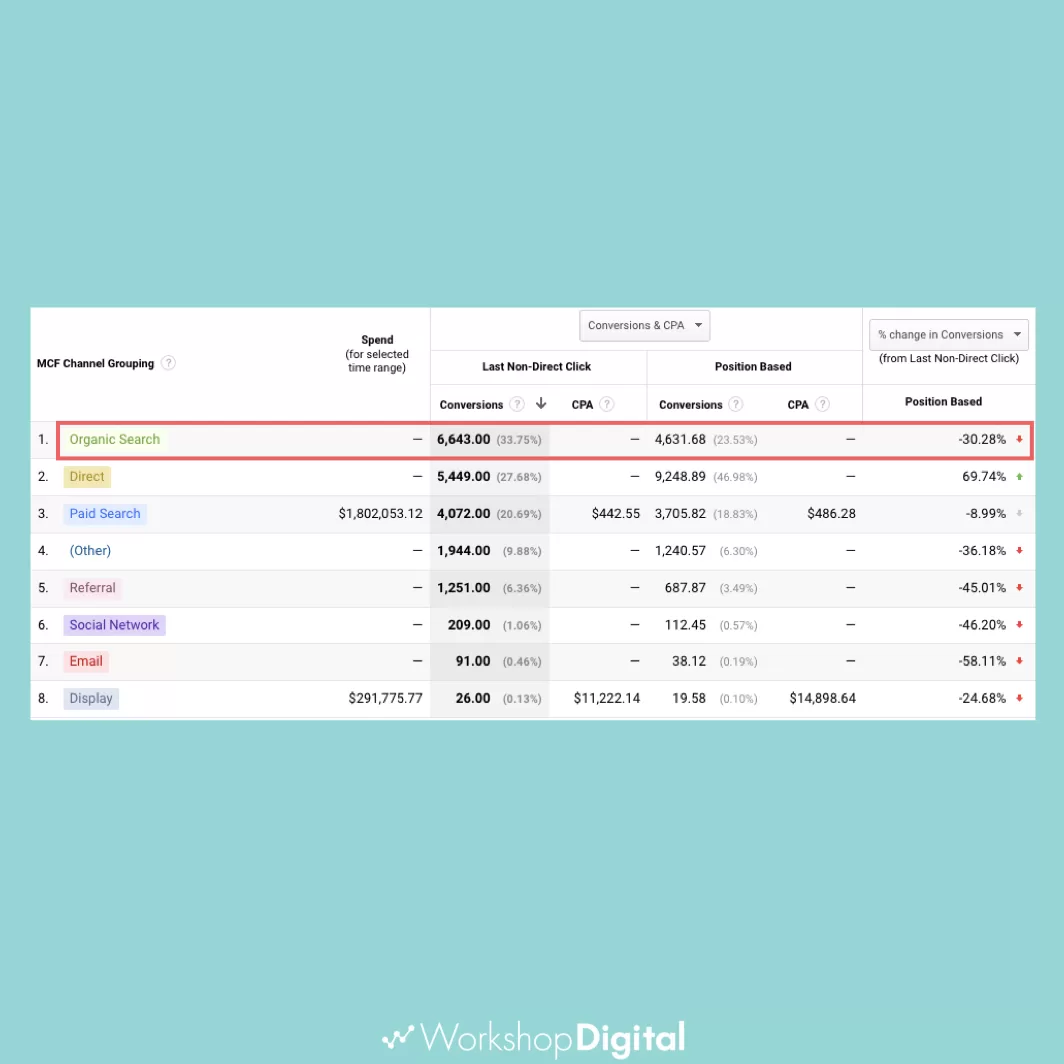
Use the Model Comparison Tool to see channel contributions in a different light.
Pull It All Together
The customer journey is never a straight line from ad to website to conversion. The more you can measure each channel’s contribution, the better you can allocate spend/time.
Want to take it to the next level? Start asking the right questions and challenge assumptions:
Are there any “must have” channels?
How granular do we need to go?
Which attribution model can we agree on?
Does our chosen model introduce bias?
Are we prepared to accept the results?