
In October, I had the opportunity to present at the Women in Tech SEO Philadelphia conference, where I shared how RStudio can be used to transform SEO analysis and reporting. My session focused on how you can use RStudio to go beyond spreadsheets to uncover deeper insights, automate manual tasks, and make data-driven decisions more efficiently.
While RStudio may seem intimidating at first, it offers endless possibilities for SEO, from clustering keywords to forecasting traffic to building visual reports. By integrating RStudio into your workflow, you can move past the limitations of manual tools and start working on your data at scale while saving time.

What is Statistical Programming?
In technical terms, statistical programming is the application of programming to perform data analysis, manipulation, modeling, and visualization, using languages like R, Python, or SAS to extract insights, build predictive models, and generate reports from data. Looking at it from a general perspective, statistical programming is a skill that can help you analyze, visualize, and communicate data.
Statistical programming allows you to:
Handle large datasets
Automate workflows
Make data-driven decisions
Visualize large datasets
Increase efficiency
All of those things lead to becoming a better marketer and a better strategist. A few popular statistical programming tools include Python, SPSS, Tableau, and… RStudio.
What is R & RStudio?
To use RStudio, it’s important to distinguish between the program itself and R, the code itself. R is a popular programming language that is free and open source and can be used to analyze and explore data. It is good at crunching numbers, running analyses, and making clear charts.
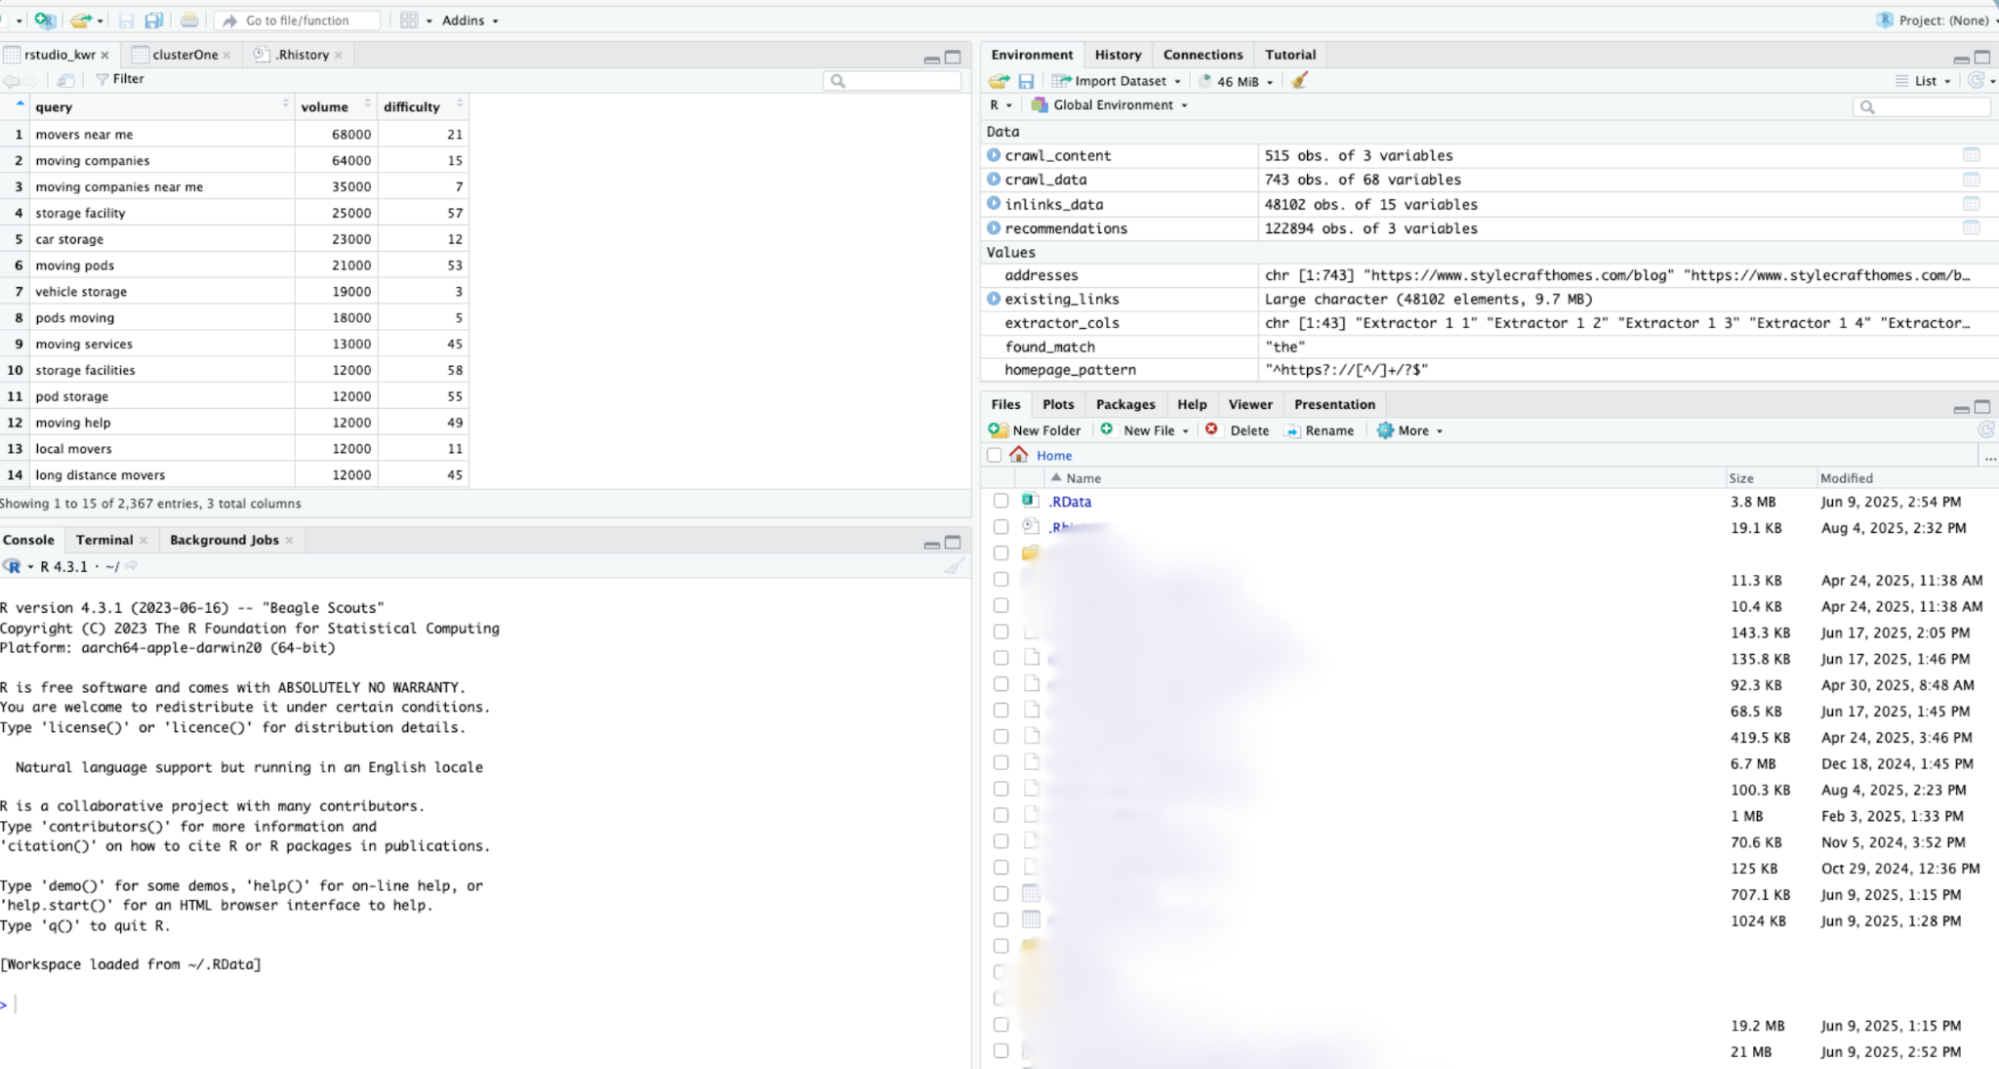
Since R is the code itself, RStudio is the environment where the code goes:
How to Use RStudio as a Marketer
You may be thinking, “I’m not a programmer, how does this even relate to me?” RStudio can help you with the marketing tasks that you already do (or even some you can’t do now because of time or tool limitations), such as:
Keyword research with clusters
Causal impact
KPI forecasting
Keyword cannibalization analysis
Audience clusters
Keyword density
Sentiment analysis
For RStudio to work, you need two things: an idea and the code to actually implement it. Now that we have access to ChatGPT and other AI tools, you can use your marketing brain to ideate use cases, and then use the AI tool to create the actual code. You no longer need to write (or even fully understand) the code to automate time-consuming processes.
Couldn’t I Just Use ChatGPT For This Stuff?
Although I encourage you to use ChatGPT or other LLMs to write RStudio code, it’s important to know why you shouldn’t always use them for the actual processes we are using RStudio for.
Hallucinations. There is always a chance that LLMs will make up something that isn’t correct. If the code isn’t right, it won’t work, which is a better risk than trusting blind KPI forecasts or weird keyword clusters.
Accuracy. You can never guarantee that ChatGPT will look at all of the data you provide. RStudio is certain to use the data and is not biased.
Privacy. RStudio works in its own environment on your computer, meaning that any data is private and only accessible by you.
Instead, you can use ChatGPT and RStudio together to build new code and processes. You are the strategist who can create predictions based on data; get ChatGPT to do the manual work by writing the code so you can focus on strategy. ChatGPT can also break down R code for you to tell you what each section of the code is doing, so you know everything that you are running within RStudio.
It’s important to consider the balance of efficiency and accuracy, especially now more than ever, with the rise in AI usage. Ask yourself: can you do a task with an LLM to make it more efficient? Yes, but how does it affect the accuracy? How can you keep the balance between the two without also wanting to tear your hair out due to the time-consuming processes? Let’s dig into a few use cases where RStudio can help maintain that equilibrium.
RStudio Use Cases for SEO
I compiled R code for three different use cases in this Google Doc, but here are the step-by-step processes for each. To get started, download R and RStudio to your computer.
Keyword Clustering
The Keyword Clustering RStudio code looks at a list of keywords and groups them based on their similarity. To run this code, you need RStudio, a list of keywords, and a few lines of code. The steps are as follows:
1. Get and clean up the data.
To obtain the actual keyword list, there are several different ways to do so, such as through Semrush or Google Search Console. I typically pull in the client’s list of keywords and a few competitors’ lists of keywords into a spreadsheet and then import it into RStudio.
You will then use a small piece of code to clean up the data, which will remove any weird capitalizations, different languages, punctuation, etc.
2. Find the optimal number of clusters.
Once you have the cleaned-up list in RStudio, you will then determine the optimal number of clusters, where the groups are neither too specific (i.e., too many clusters) nor too vague (i.e., too few clusters). You can do this with a piece of R code that creates a curved graph:
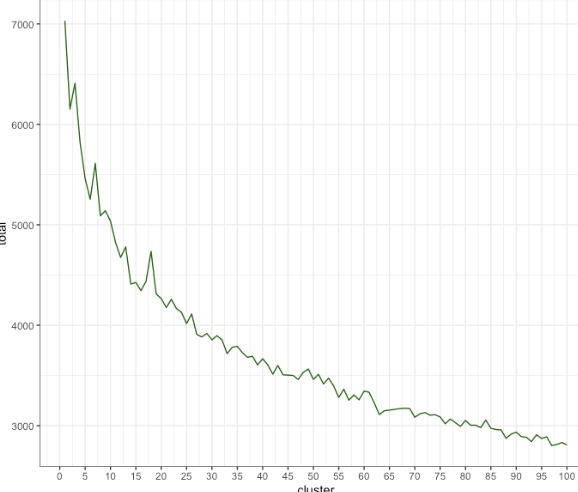
You will then look at the graph to find the inflection point, where it moves from the steep part of the graph to where it wanes out. It’s not an exact science, so I recommend making your best estimate and then adjusting it later on if needed by re-running the code with a different number of clusters. For this graph, I chose 25 clusters, but you could argue 20 or 30.
3. Set up the clusters.
Now that you have your keyword list and the number of clusters you need, you will run a few lines of code that tell RStudio to look at the keyword list, sort them into 25 clusters, and then show you the clusters.
4. Download the results (and save time!).
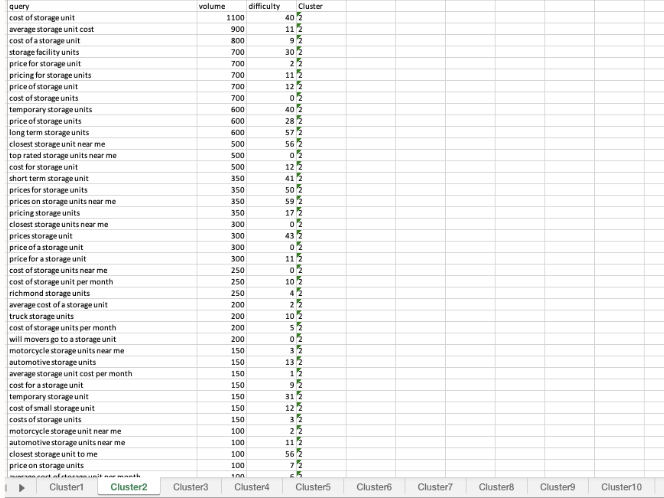
Once the clusters are created in RStudio, you can export them into an Excel spreadsheet, and you are done in RStudio for this process! The sheet will have each cluster as a separate tab:
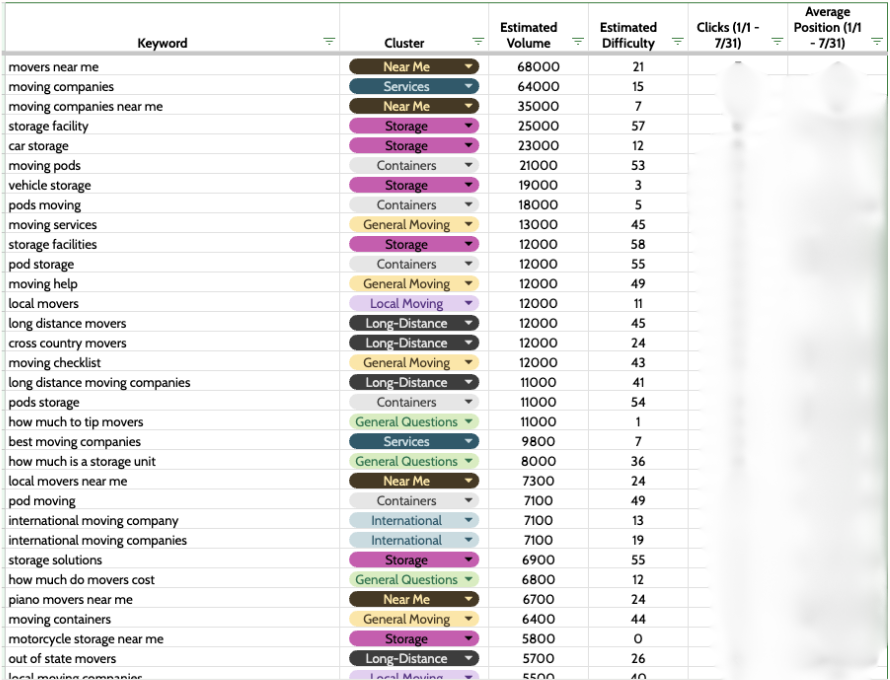
I like to then clean up the clusters by removing any irrelevant groups, changing the cluster names to be more easily understood, and changing the formatting. As a result, you could end up with something like this:
Using RStudio to group all of these keywords is beneficial for various reasons, including:
Identifying how users search for different topics. For the example above, we were able to pinpoint that people looking for local moving services were searching for completely different keywords than long-distance moving services.
Removing irrelevant keywords. Whether they were completely irrelevant or were not important for the client, you can easily remove keyword clusters, rather than manually finding the keywords and deleting them.
Finding blog and other content ideas. RStudio tends to group questions into one cluster, which is a great resource for seeing what questions people are asking and using that to your advantage.
Saving time. This tool can group thousands of keywords, which would take a huge amount of time when done manually.
Our old keyword clustering process took about 12-20 hours before, and most of that time was spent just setting up the spreadsheet and cleaning up the data. The RStudio process saves 10-15 hours, which is over 75%! This means you can spend time figuring out what keywords you want to target and doing the actual analysis part of marketing, rather than the data setup part.
From start to finish, the code takes about 5-10 minutes to run. This is a great example of staying proactive, rather than reactive, for this shift to being more efficient and data-driven.
KPI Forecasting
With all of the changes to search with ChatGPT, AI Overviews, and more, SEO KPIs are harder than ever to predict… but what if you could at least provide some data to back them up?
The KPI forecasting process with RStudio allows you to forecast performance for the next 12 months based on historical data, rather than just guessing. All you need for this is:
Historical data (from Google Search Console, Google Analytics 4, etc.)
RStudio code
To run the code, you only need to change one snippet:
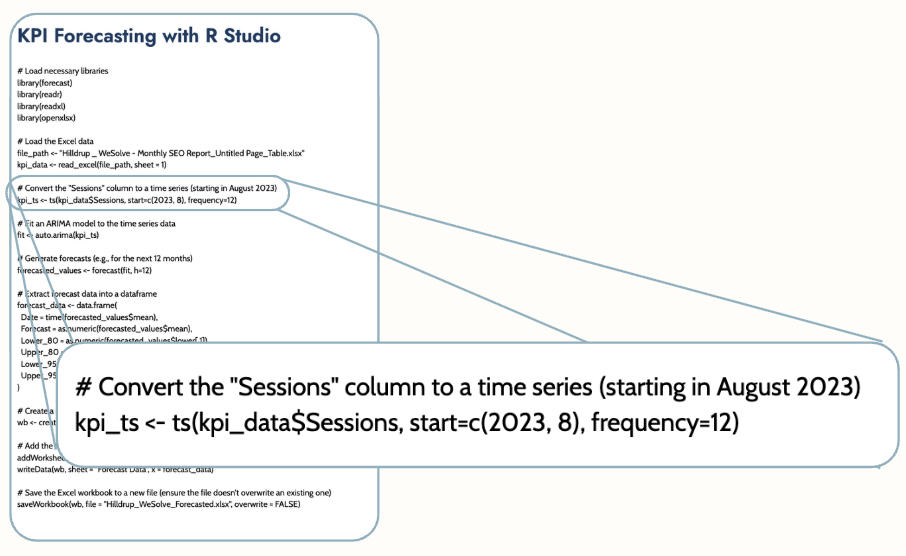
You need to change the date where the historical data starts(“2023, 8”) and the name of the column (“Sessions”). Once you run the code, you will get a chart that looks like this:
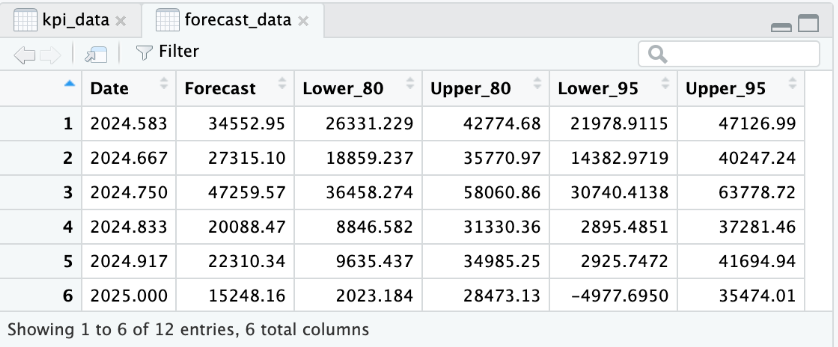
Here is what each column means:
Date: the forecasted month. Once you export this chart, make sure to change the format to be months, rather than a number.
Forecast: the forecasted performance for each month.
Lower and Upper 80: the 80% confidence interval (the model is 80% sure it will fall into this range)
Lower and Upper 95: the 95% confidence interval (the model is 95% sure it will fall into this range); this range will be larger than the 80% confidence interval since the confidence level is higher.
Once you get the chart, you are ready to export the data and use it to inform your data-driven KPIs. I usually create a chart and add a few formulas in Google Sheets to end up with something like this:
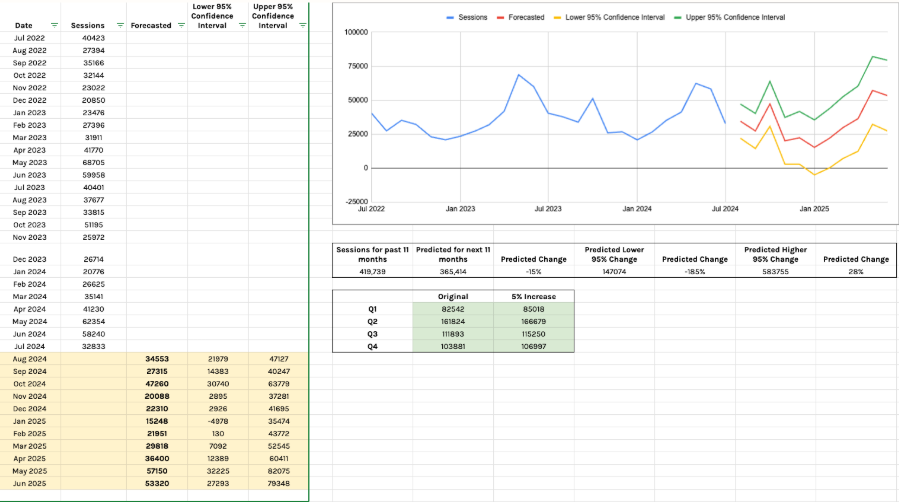
This process can save you 2-3 hours and provide more accurate forecasting for your marketing goals.
Keyword Cannibalization Analysis
The keyword cannibalization analysis identifies any pages that are “fighting” with each other for certain keywords. This means that users (and search engines) may not be sure what page is the right fit for what they are looking for.
This code is more mathematically-based, so let’s walk through the steps that the code will go through:
Load the packages so the code can run.
Import your data.
Filter out any rows where clicks are equal to zero (meaning a keyword didn’t get any clicks).
Calculate click share (Clicks Per Page for the Keyword / Total Clicks)
Remove any keywords where total clicks are less than 10 (you can adjust this number depending on the size of the website)
Find keywords where more than one page appears AND top click share is less than 90% - meaning any pages that may be cannibalizing each other’s performance.
- Label the severity of the cannibalization depending on the click share.
If the top click share is less than 70, it is marked as “Severe”.
If the top click share is between 70 and 90, it is marked as “Moderate”.
If the top click share is 90 or above, it is marked as “Low”.
This is what the results look like:
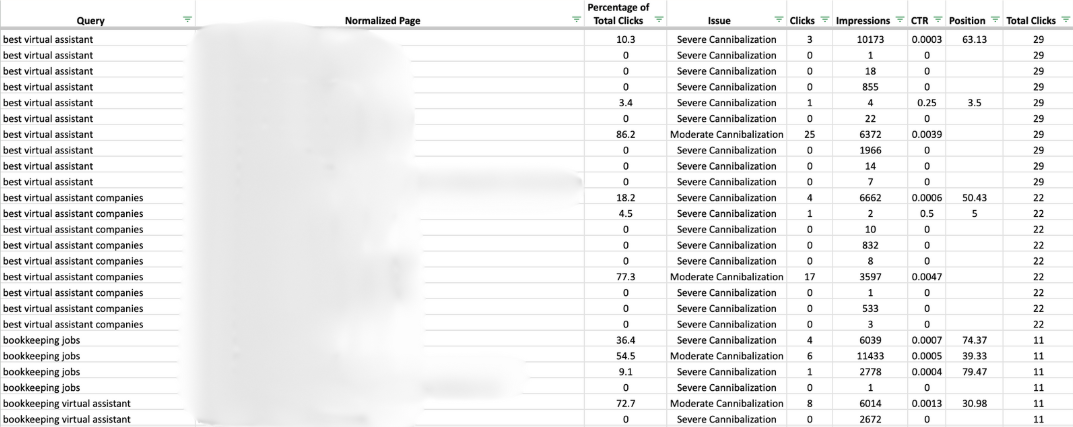
Honing in on a specific example, we ran this analysis for a client that provides virtual assistant services. We realized that there was severe cannibalization for the keyword “virtual assistant jobs”, because they had three pages appearing:
Their homepage
Their “Virtual Assistant Jobs” page (the most relevant page)
Their “Work With Us” page (their corporate jobs page), which was getting the most clicks

The most relevant page was only receiving 15% of clicks, indicating that people were confused about which page was the right one and were not having the best experience on the website. This analysis provided data-backed reasoning for why we should differentiate the “Work With Us” page to help people find the “Virtual Assistant Jobs” page, which is the most relevant page for the keyword.
This Keyword Cannibalization Analysis saved us over 20 hours, and for bigger websites, we may not have been able to do this in the past. You will also get data-backed recommendations faster, rather than having to make guesses on what content needs to be changed.
How to Use RStudio For Your Own Analysis
I outlined a few use cases above, but the code itself is not “one and done”. You may end up scrapping my code completely and making a new one for yourself that works better for you. For example, for the Keyword Cannibalization Analysis, you could add click or impression limits, make a weighted severity score, group by page type, and more.
When you start brainstorming use cases, think of your pain points: what is taking a long time to do now? What do you wish you could do, but can’t? What feels repetitive and manual?
Then, use your analytics brain to find patterns and opportunities to use RStudio. The keyword clustering code was born because I knew there had to be a better way to conduct that process than spending 20+ hours on it.
If you’re not sure if RStudio can accomplish your ideas, do some research! There are plenty of resources out there, like R for SEO, or you can ask ChatGPT if it is possible. Overall, there is no harm in testing things out; if it doesn’t work, you can just go back to the old process. But a lot of the stuff we do as marketers can be done in RStudio.
Stay Proactive, Not Reactive
In this new age of AI, staying proactive is more important than ever. Not sure where to get started with your digital marketing? Contact us today to get a free consultation.