Through detailed behavior analysis, we uncovered structural barriers in the user journey and delivered a roadmap that makes it easier for visitors to engage, explore, and convert.
The Challenge
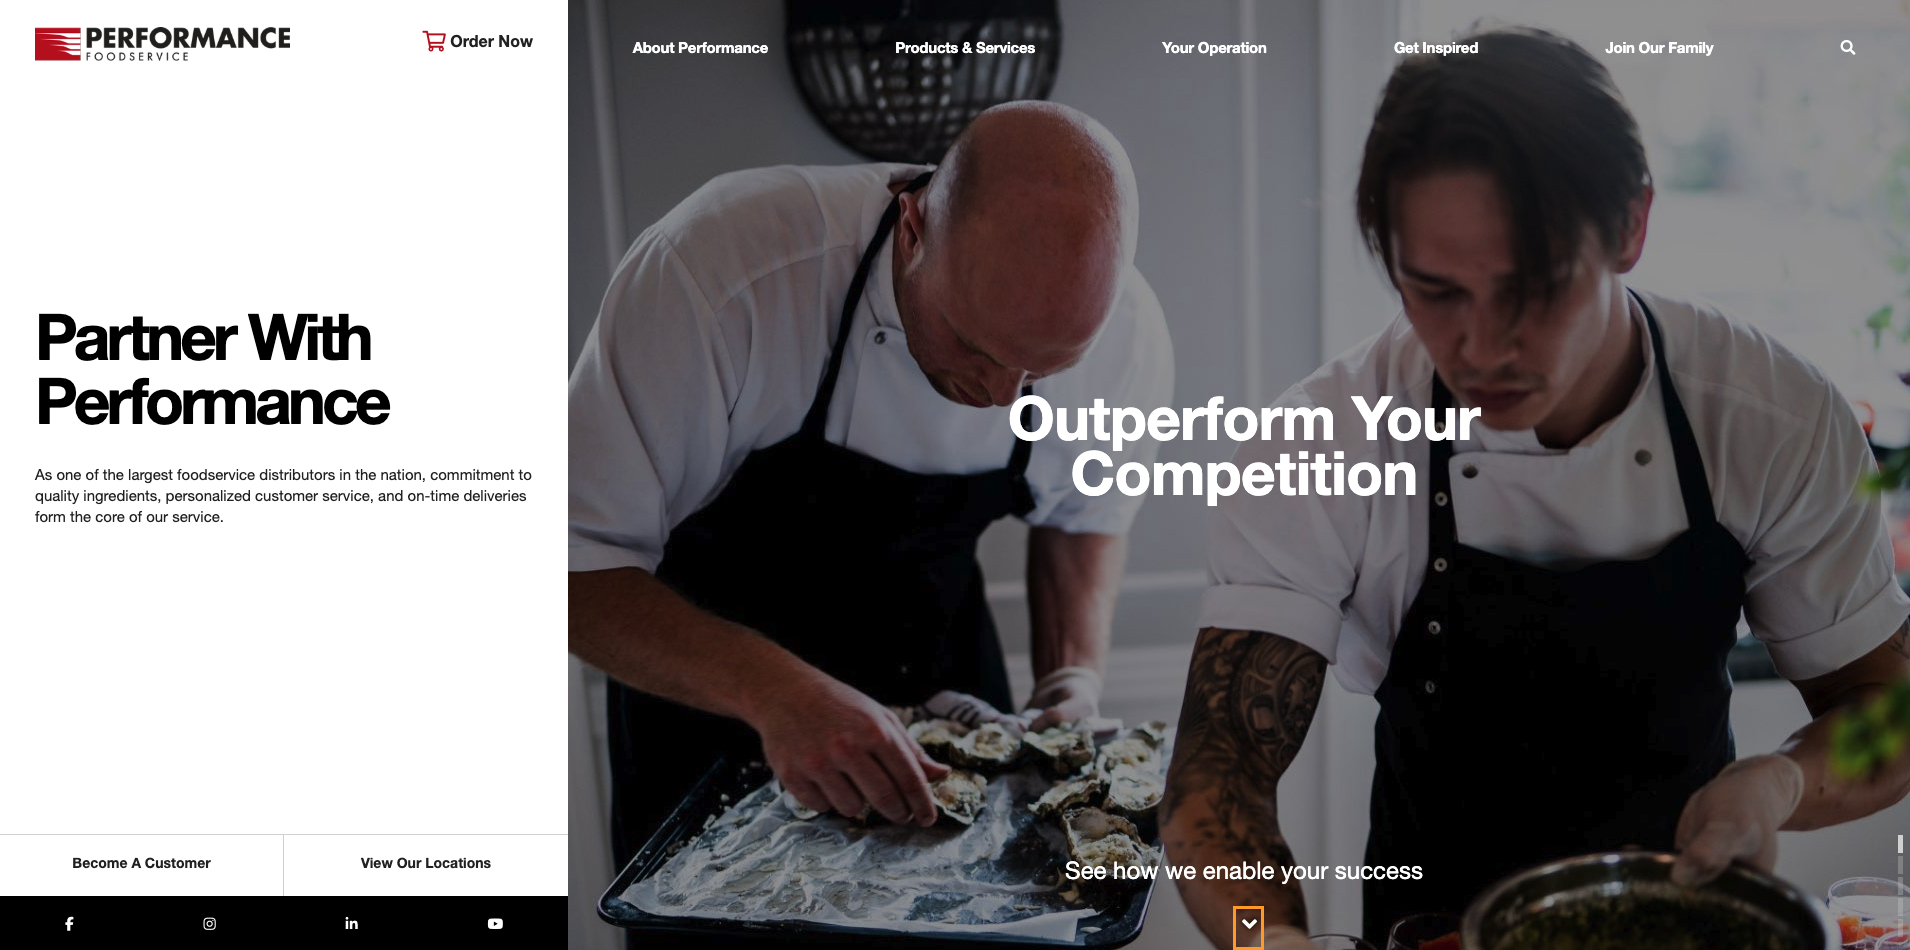
Performance Foodservice had strong brand visibility, but key content and CTAs sat too far below the fold to drive engagement. Users weren’t reaching important messaging, and the “Become a Customer” path added friction with an extra landing page and a long, single-step form. The site looked polished, but the structure made it hard for visitors to convert.
The Outcome
Our analysis revealed clear opportunities to raise high-value content and streamline the conversion flow. Pages with above-the-fold content saw 2× higher engagement, and simplifying the “Become a Customer” form helped drive a 38% YoY lift in submissions. These insights gave PFS a data-backed path to reduce friction and improve site-wide conversion performance.
The Story
Performance Foodservice (PFS) sought to gain a deeper understanding of how visitors interacted with their website and identify opportunities to enhance conversion rates and increase content engagement. The company had strong brand visibility, but our analytics audit revealed that key pages and calls-to-action (CTAs) weren’t performing to their full potential.
To uncover the “why” behind these user behaviors, PFS partnered with our analytics team to conduct a Digital Measurement Strategy. The goal was to decrease abandonment rates on high-value areas of the site, particularly the homepage hero content and “Become a Customer” form, to improve lead generation.
The Challenge
Analysis of on-site behavior between February 9, 2025, and April 9, 2025, revealed a few clear friction points in the user journey:
Key content was buried below the fold. Only a fraction of users scrolled far enough to reach important messaging or CTAs.
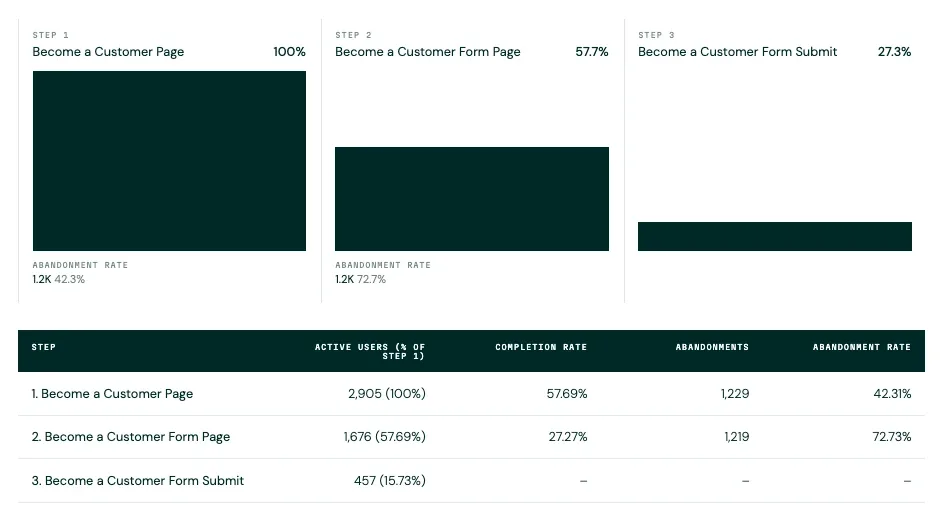
The “Become a Customer” funnel had a major drop-off. 42% of users who clicked “Become a Customer” reached the form page, and only 27% of those users completed it.
Competitors outperformed on layout and efficiency. Sites like other competitor foodservice distributor sites presented relevant content and conversion points higher on the page, with leaner, multi-step forms that reduced friction.
In short, PFS’s site was visually strong but not structurally optimized for user engagement and lead conversion.
The Strategy
We approached this challenge with a dual focus on content hierarchy and conversion rate optimization.
Hero Content Optimization:
Benchmarked PFS’s page performance against user-behavior data from the Nielsen Norman Group and internal surveys, confirming that 57% of viewing time occurs above the fold.
Identified pages where important content appeared below the fold and compared engagement metrics against those with above-the-fold content.
Recommended redesigns that elevate hero CTAs and brand messaging for stronger initial engagement.
Form Conversion Optimization:
Mapped the full user journey from the “Become a Customer” CTA through to form submissions.
Benchmarked against competitors who direct users straight to multi-step forms instead of a single-page layout.
Recommended removing the intermediary landing page and converting the form into a multi-step process aligned with HubSpot’s best practice of simplifying form fields per step to increase completion rates.
The Results
By analyzing and restructuring content placement and form flow, PFS discovered key patterns that will inform ongoing design improvements and marketing performance.
| Page Type | Content Placement | Avg. Engagement Time | Avg. Session Duration |
|---|---|---|---|
| /About-Performance | Below fold | 18 s | 1 m 08 s |
| /Products-and-Services | Below fold | 24 s | 1 m 02 s |
| /Get-Inspired/The-Dish | Within initial fold | 36 s | 1 m 54 s |
| /Your-Operation/Techonlogy | Within initial fold | 38 s | 1 m 37 s |
Takeaways:
Pages with content visible in the initial fold saw 2x longer engagement and 50%+ higher session duration.
Conversion analysis showed that simplifying the form flow could lift form completions by an estimated 30-40%, based on benchmarked averages.
These findings positioned PFS to make data-driven design updates aimed at lowering cost per lead (CPL) and improving overall site ROI.
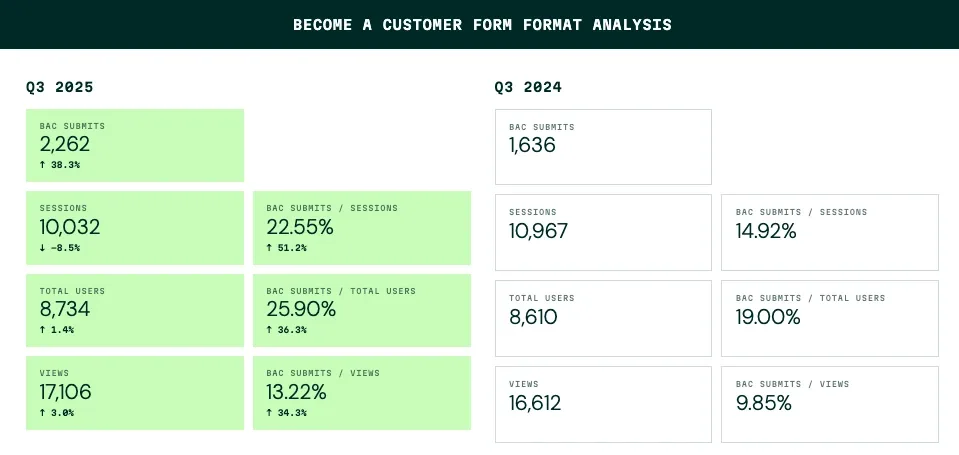
"Become a Customer" Form Format Analysis:
| Metric | Q3 2024 | Q3 2025 | YoY Change |
|---|---|---|---|
| BAC Submits | 1,636 | 2,262 | ▲ 38% |
| Sessions | 10,967 | 10,032 | ▼ 9% |
| BAC Submits / Sessions | 14.92% | 22.55% | ▲ 51% |
| Total Users | 8,610 | 8,734 | ▲ 1% |
| BAC Submits / Users | 19.00% | 25.90% | ▲ 36% |
| Views | 16,612 | 17,106 | ▲ 3% |
| BAC Submits / Views | 9.85% | 13.22% | ▲ 34% |
Takeaways:
BAC submissions increased 38% YoY, even with slightly fewer sessions.
Conversion efficiency improved significantly, with BAC submits/sessions up 51% and BAC submits/users up 36%.
Engagement improvements (BAC Submits/Views up 34%) demonstrate that the simplified, multi-step form design effectively reduced friction and motivated completion.
Want to discover how page layout optimization can improve your website performance? Connect with our team to start your own site engagement study and drive growth in lead quality and conversion rates.