
The first three quarters of the year have tested everyone’s resilience and optimism. Q2, in particular, brought hesitation from many businesses, uncertain about their marketing priorities. Growth has been challenging, and some industries have felt that more than others.
Concerns such as tariffs, inflation, and cautious spending ranked among clients’ top concerns. Adding the rapid rise of AI and intensified competition has made every lead feel like a battle.
Now’s the time to sharpen our strategy, strengthen our story, and move forward with the confidence that comes from knowing our clients, our competition, and ourselves.
In this blog, you'll learn which key analytics reveal how macroeconomic trends are affecting your performance.
Is Inflation Causing Your Traffic Downturn?
By now, everyone is fully aware that things cost more. Have you looked at your grocery bill recently? Basic economics tells us that when things cost more, people tend to buy less.
Looking back at 2025, inflation saw a slight year-over-year increase and, as of the end of September, sits at about 3%. In 2026, inflation is still expected to rise, driven in part by tariffs. Combine that with the upcoming holiday season, and wrapping up Q4 could feel especially tight.
Since none of us can control the economy (and simply hoping someone allocates their remaining budget your way isn’t exactly a strategy), the question becomes: how can we get ahead of inflation and adjust our approach? The best place to start is by looking at the data.
What Data Should I Be Looking At?
It’s easy to blame a business slowdown entirely on the economy. While there is often some truth in that, there’s always more to be done. To determine whether inflation is the cause of your downturn, start by examining your year-over-year (YoY) performance.
How are your conversions and traffic trending? Are people genuinely spending less? Whether or not these trends move up or down tells a lot about your unique situation.
Remember: data tells a story. If conversions are down but traffic is up, that could signal that people are still interested, but hesitation is creeping in. That hesitation could stem from many factors beyond cash flow. So, what can you do to help move those potential customers forward?
For example, if 25% of your leads drop off after the first email, it may be time to A/B test your headings and copy to see what works and what doesn't.
This is also an ideal time to take a closer look at your conversion funnel. Start by asking:
What steps do users take to become a customer, and how have those steps changed YoY?
Are they dropping off at the same stage as last year, or somewhere new?
How does your conversion rate shift after each step?
A deep examination of your conversion journey can reveal valuable insights and uncover opportunities to keep prospects moving further down the funnel.
Additional metrics to watch:
Bounce Rate - Which pages have the largest bounce rate, and should they? If your main service or product pages have bounce rates above 75%, it's worth reviewing those pages. Are users finding what they need easily, or are they bouncing out of frustration?
Scroll depth - How far down the page are users scrolling? This metric pairs closely with bounce rate. If important content sits too far below large images or filler text, you may be losing engagement. Make sure users can access key information early!
Gathering and analyzing this data gives you a clearer picture of performance amid inflation. From there, the next challenge is figuring out how to overcome the hesitation many consumers are feeling… and turn interest into action.
Is Consumer Hesitation Affecting My Business Performance?
Costs are high, and prospects are hesitant. Many are now more value-focused, waiting to make purchase decisions until they’re certain they need something or have the bandwidth to act on it.
That means that showing the value of your services matters now more than ever. Clients and prospects need to understand the What, So What, and Then What of your service offerings.
What: What exactly are you offering, and how does its value compare to alternatives?
So what: Why does this matter today? How does it address your clients' pain points, and are your competitors doing the same?
Then what: After choosing your service, what does the future look like?
Figuring out where to find this data and how to share it is part of the struggle of any marketer; thankfully, we‘ve got some experience.
What Data Should I Be Looking At?
We’re not trying to throw you into the deep end of data analysis here; rather, to show you what these metrics can tell you about consumer hesitancy. Take some time to review these items and discuss them with your team members.
There are a variety of metrics you can use to get a better understanding of consumer behavior as users move through your funnel:
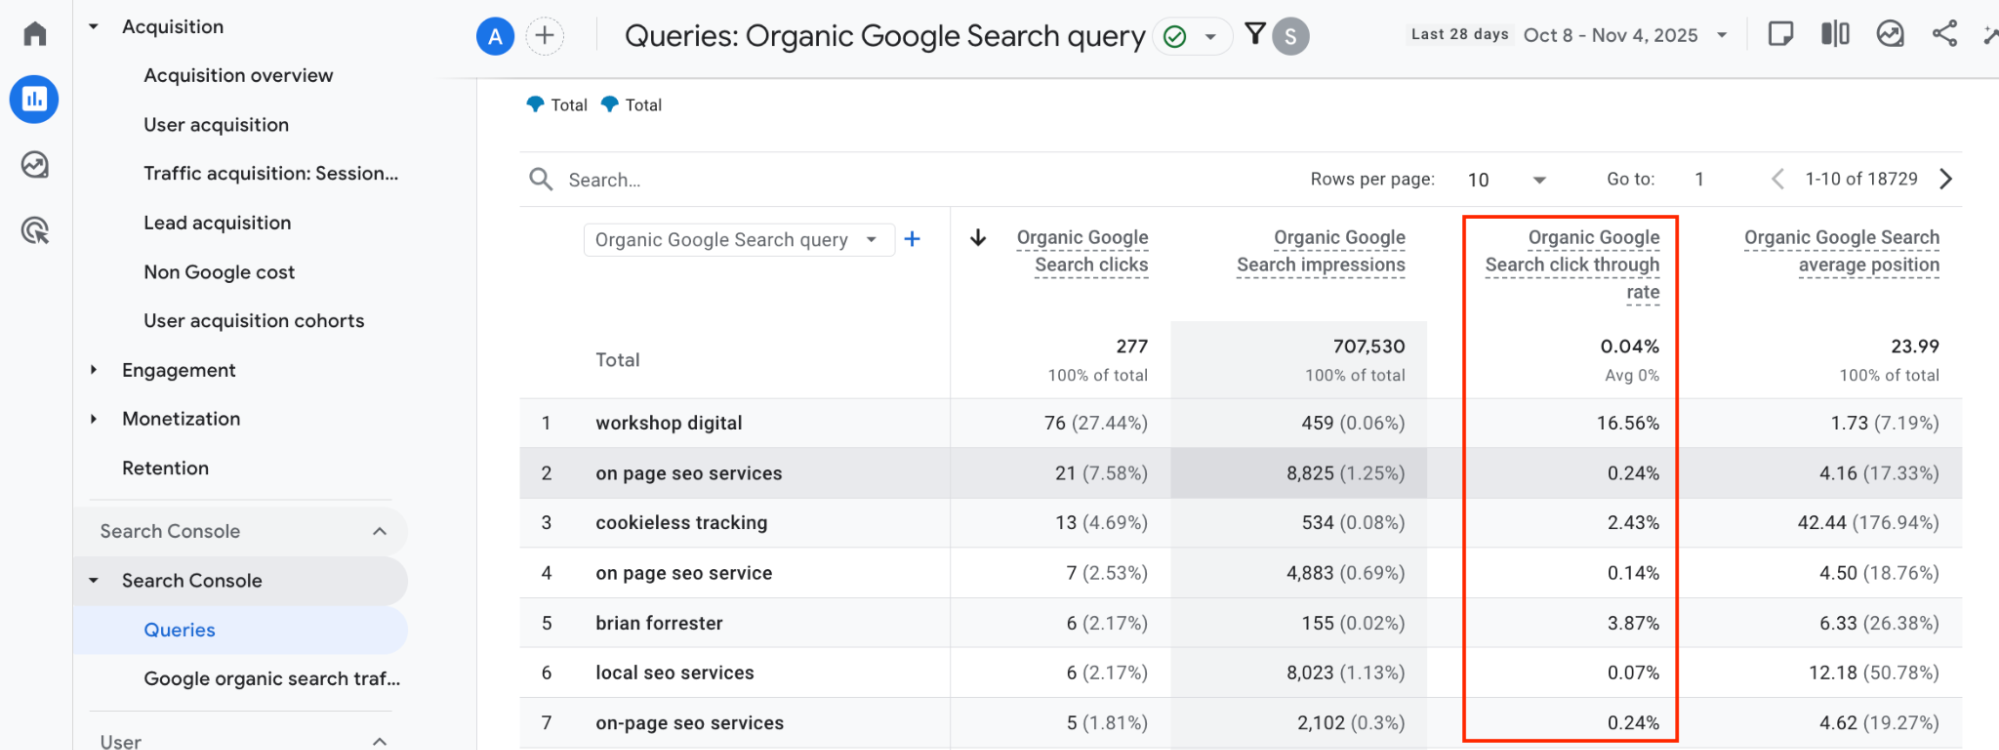
- Bounce Rate: A high bounce rate shows visitors leave after viewing only one page, often meaning they didn’t find what they expected or were unsure about proceeding.
You can find the Bounce rate inside Google Analytics 4 (GA4) in the reports section under the Pages and Screens report.
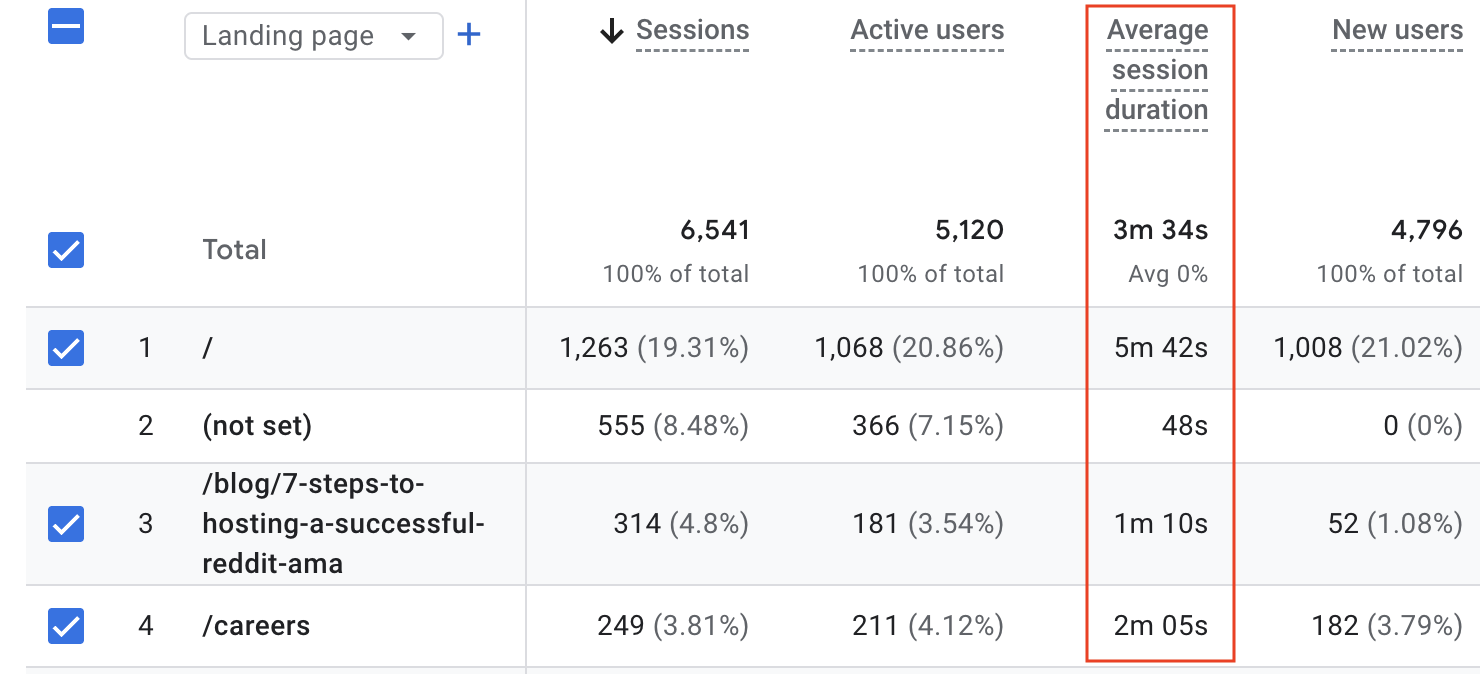
- Average Session Duration: Short session durations can signal confusion or lack of engagement, implying hesitation to move forward.
- You can find the Average session duration inside GA4 in the reports section under the Pages and Screens report.
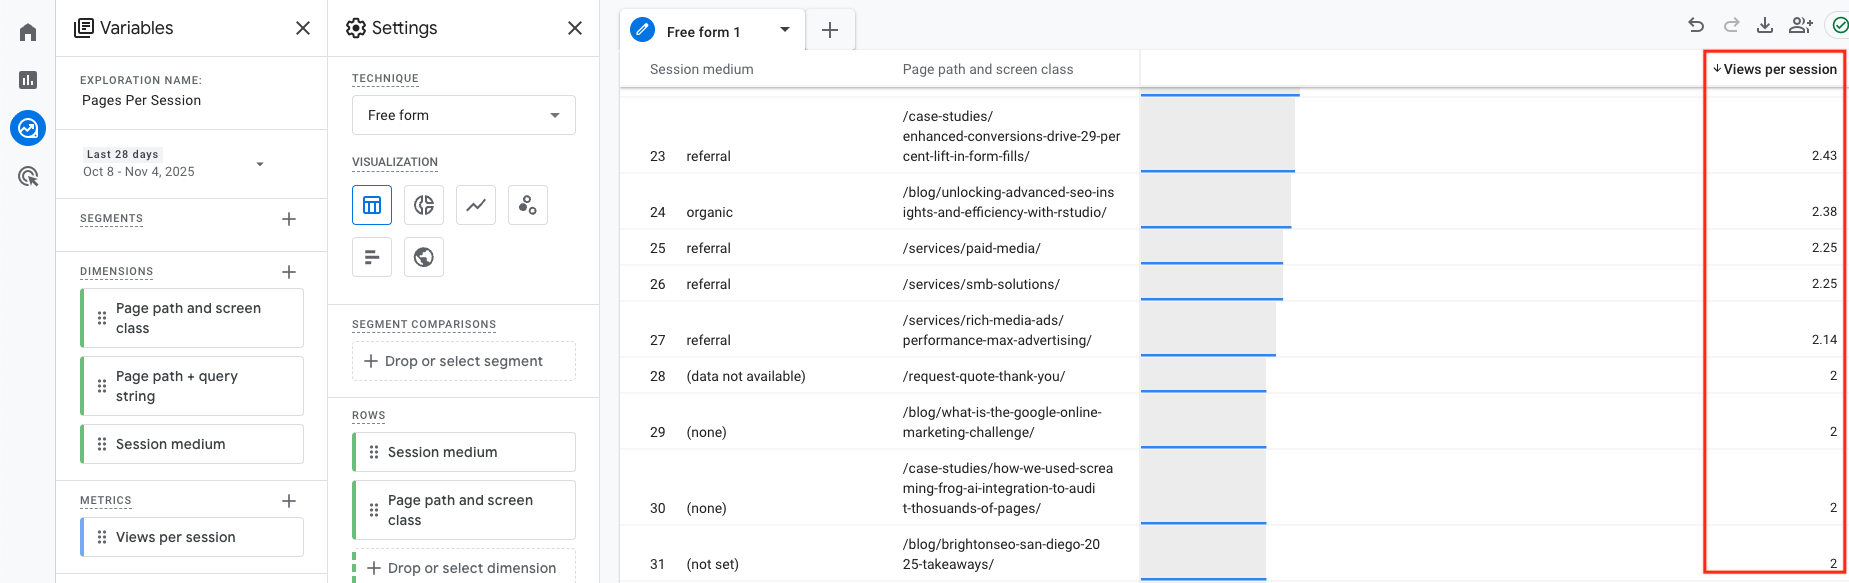
- Views per Session: Low page views per session suggest users aren’t exploring the site enough to feel confident in making decisions.
- Go to GA4 and under exploration, and create a new free-form report. Fill in the report with the variables you see in the image below:
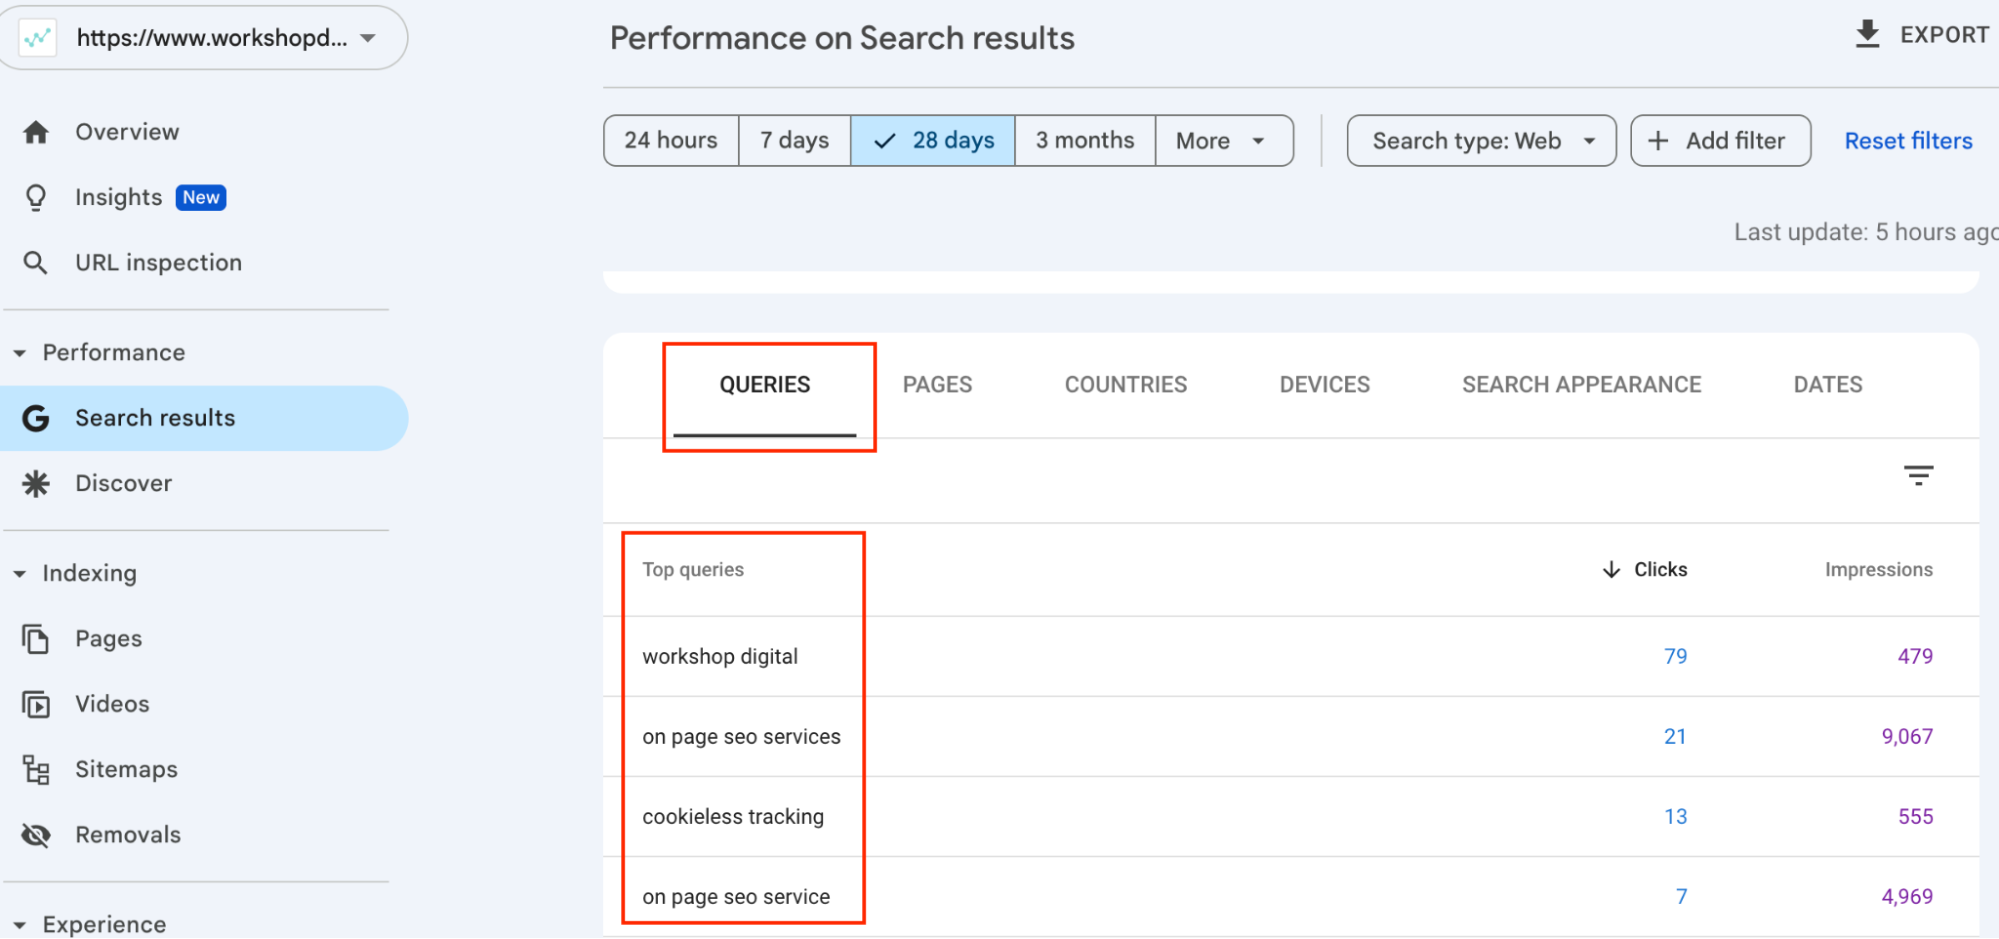
- Site Search Queries: Frequent searches for specific information or confusion about products can reveal gaps in clarity or trust.
- Inside Google Search Console (GSC), go to Performance to see queries. You may need to scroll down a bit to see the data.
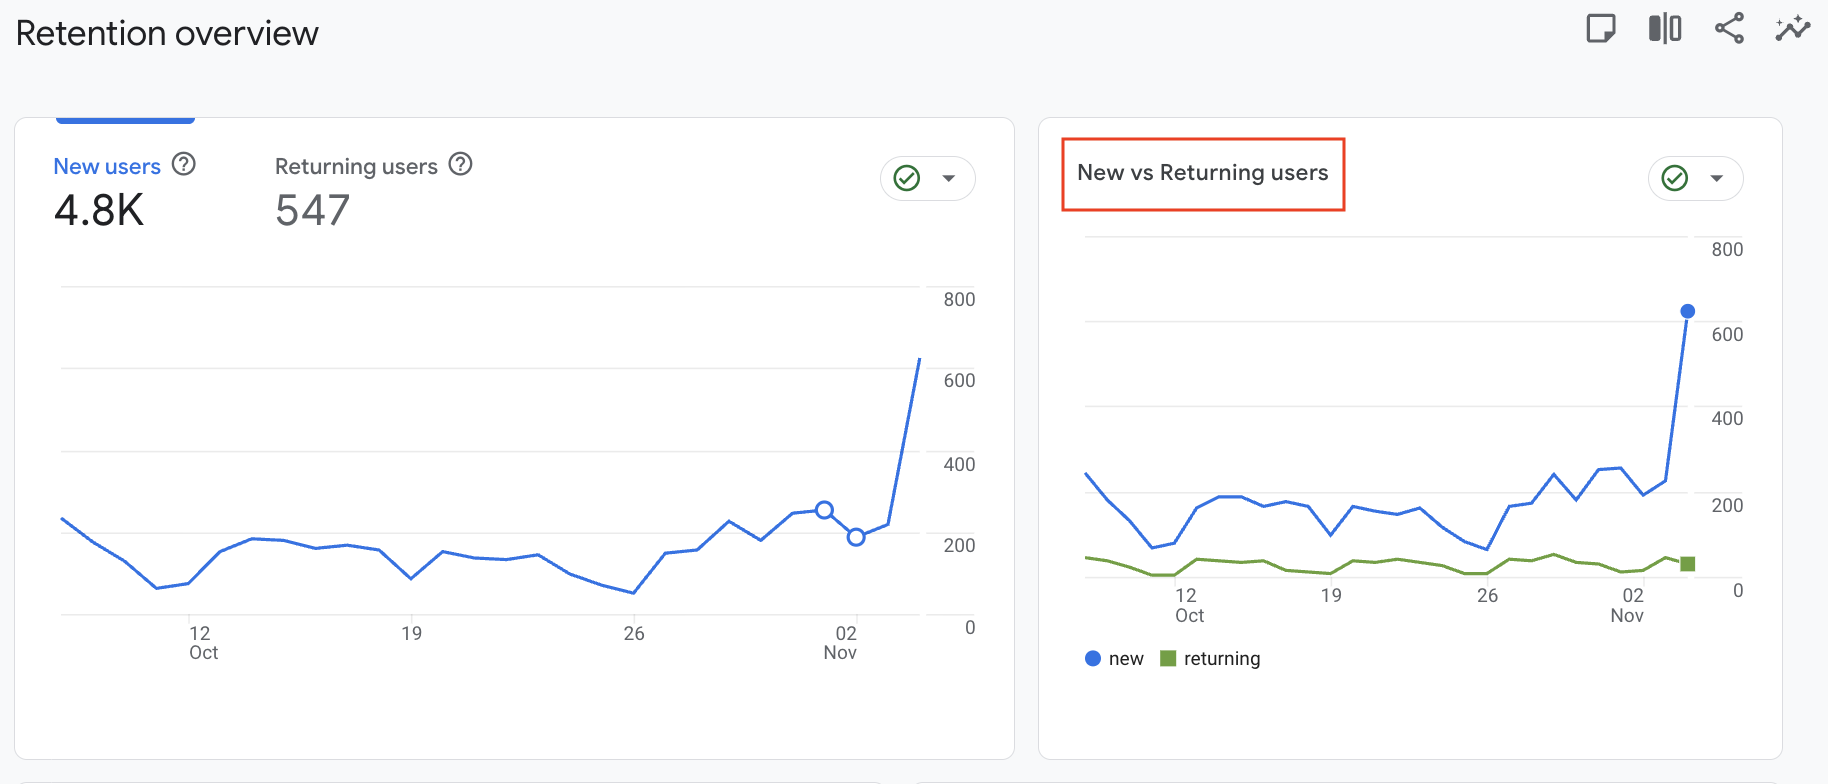
- Return Visitor vs. New Visitor Metrics: A low return visitor count alongside many new visitors indicates initial interest, but not enough confidence or satisfaction to come back.
- Go to GA4 and under reports, find Acquisition and select “Traffic acquisition”.
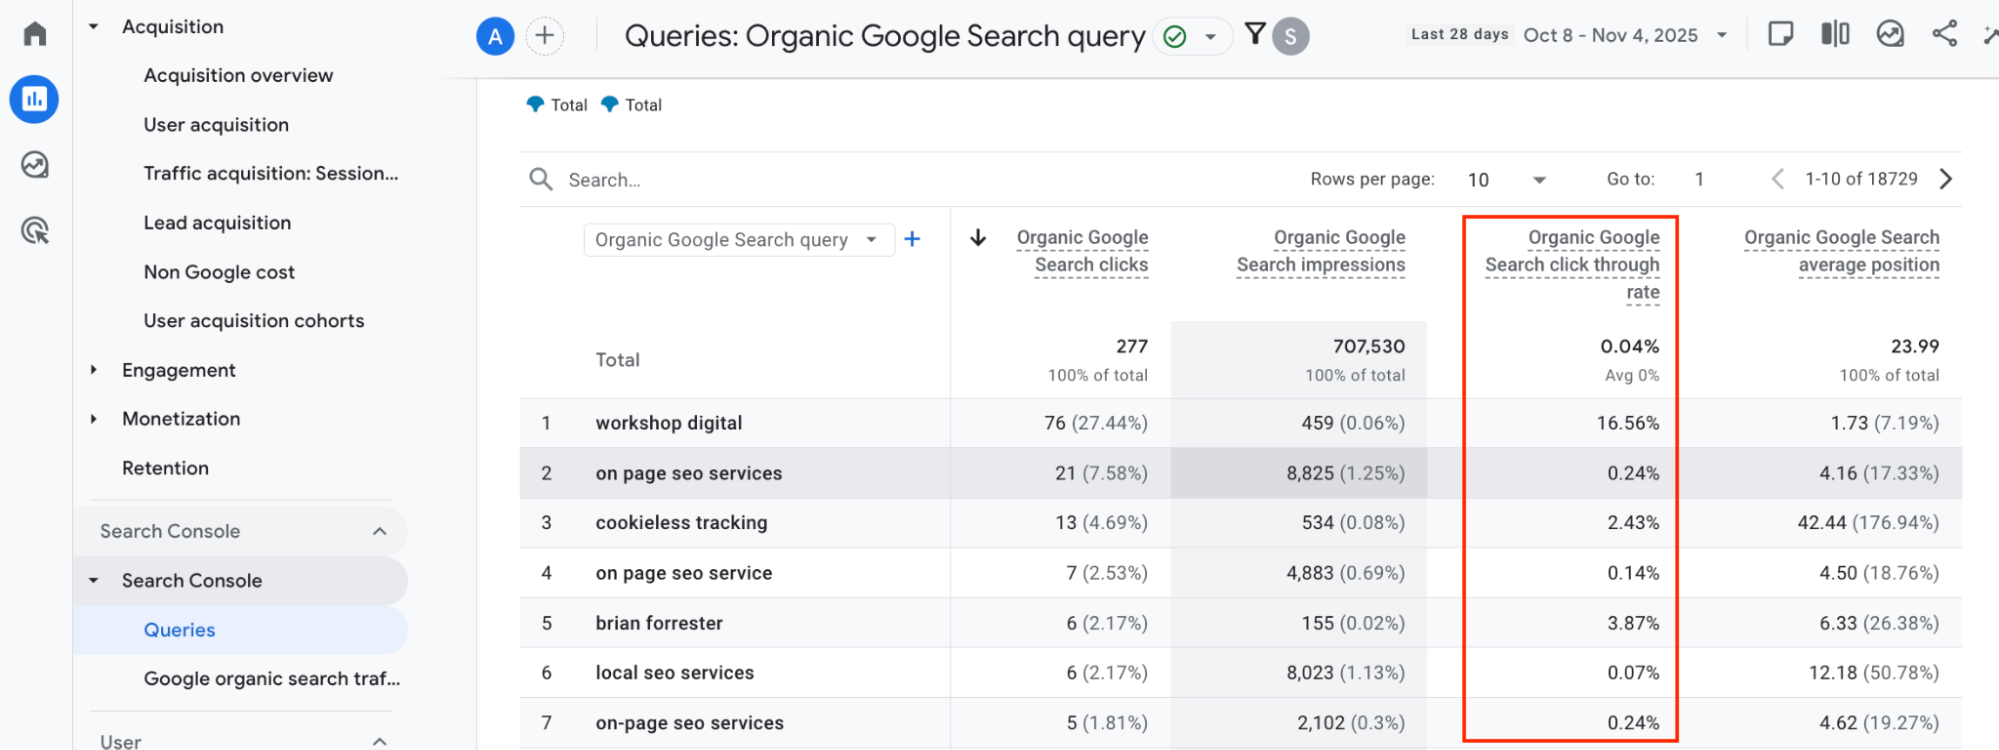
- Click-Through Rate (CTR) on Calls to Action: Low CTR means visitors hesitate to take the next steps, showing possible concerns about the offer or process.
- To see this easily without doing a manual calculation, GSC and GA4 need to be linked. From there, inside GA4, you just need to go to Reports > Search Console > Queries.
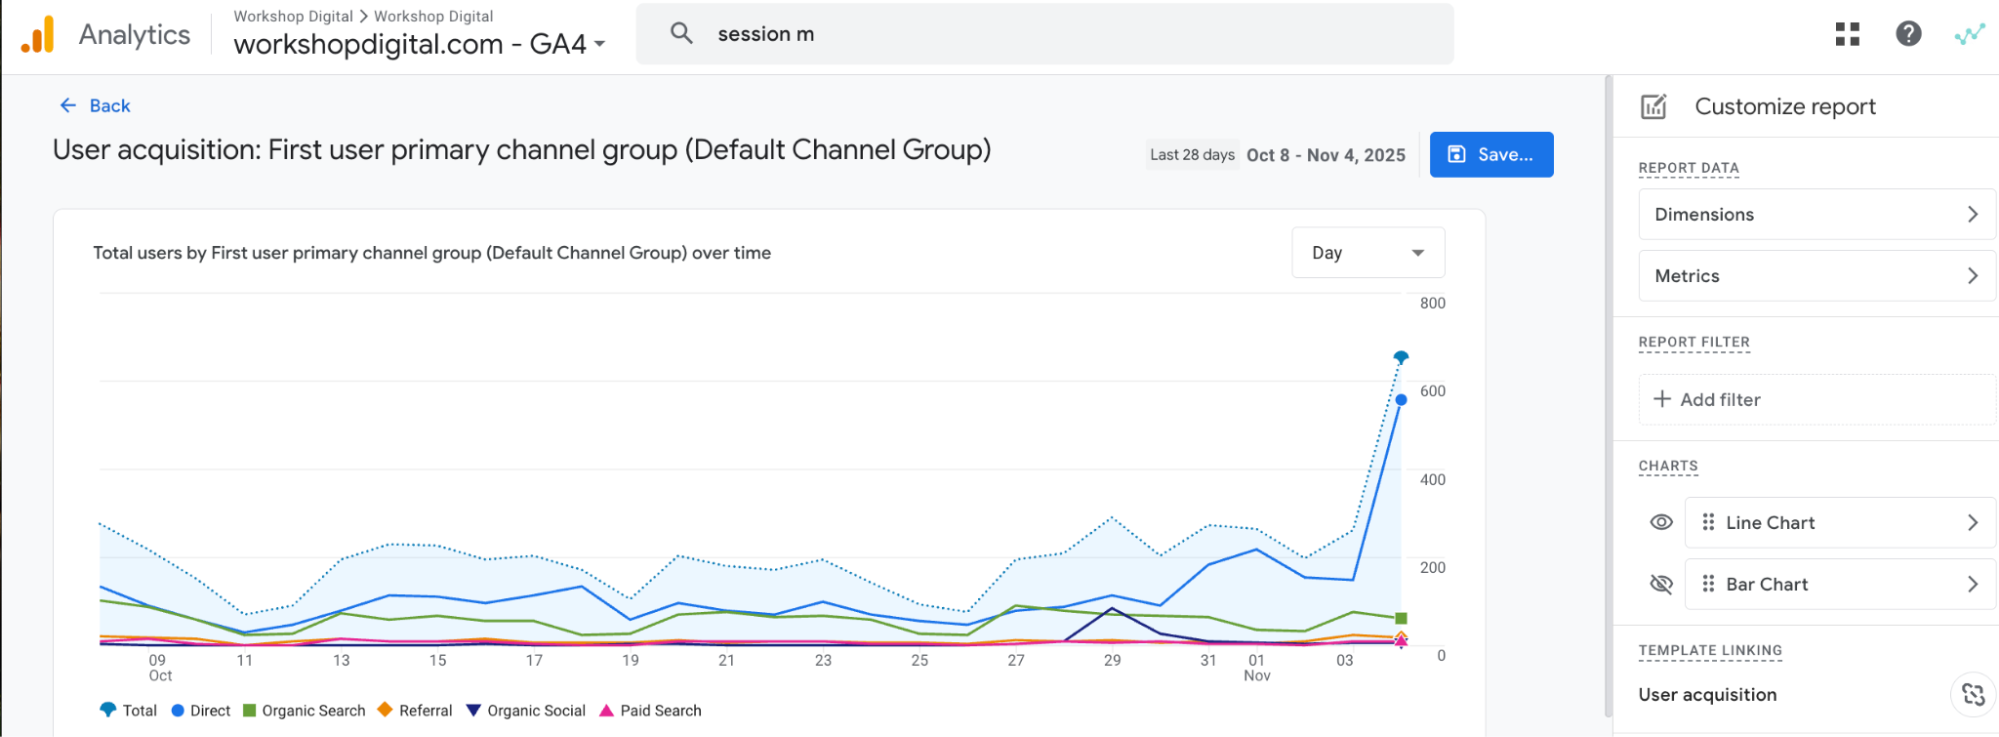
NOTE – If these metrics don’t appear in your standard report, you can easily add them. Click the pencil icon at the top right of your screen, then choose the metrics and dimensions you want to include.

If you need help setting up these accounts or analyzing this data, reach out to us, and we can help you start to understand your analytics better, which will inform future optimization opportunities.
Overcoming Consumer Hesitancy With Case Studies
When a potential customer is on the fence, they need something compelling to help them decide. For many people, results are what matter, and what better way to show results than through case studies?
Around 36% of marketers say Case Studies are effective sales tools, often outperforming other forms of content like blogs, audio, and even certain forms of video content.
While we’d all love to have beautifully designed, in-depth case studies for every client, the reality is that they take time. But they don’t have to be massive undertakings; even a few PowerPoint slides or a single-page PDF can be powerful. What matters most is that they clearly show three important things:
What were things like before
What you did
How things changed
Leveraging strong data and quality case studies can be a highly effective way to sway those undecided prospects to your side. However, even when you present a compelling case and highlight all your impressive work, prospects often have lingering questions. One of the most common we encounter is, “Can’t I just have AI do it?”, which leads into our next section.
How Has AI Affected My Business Performance?
The impact of AI is broad and complex, with many companies rushing to integrate it into their workflows and processes. Across the various industries we serve, AI's effects have been unique and varied. However, one consistent trend has emerged: AI is changing how users find information.
Instead of visiting traditional websites or moving through familiar marketing funnels, users are increasingly getting their answers directly from AI-generated results. For many businesses, that means fewer opportunities for organic engagement and conversion.
Now, we are not here to be another AI alarmist, nor are we trying to be an AI evangelist. But there is a saying out there that “AI won’t take your job; rather, it's the person who uses AI that will take your job.” AI is here to stay, and it's just another factor to adapt to, unless you know how to use it properly.
What Data Should I Be Looking At?
AI reporting is still in its infancy. Many companies struggle to get reliable metrics from any source, let alone at a reasonable price. However, there are some basic insights you can get with free tools like Google Analytics.
GA4 now provides session data from major AI and Large Language Model (LLM) tools. To view this, use the “Session source” dimension within your Acquisition reports. While traffic from these sources is often minimal (as seen in the example image, it’s only 3%), it can still be valuable to understand which AI platforms are driving visitors to your site.
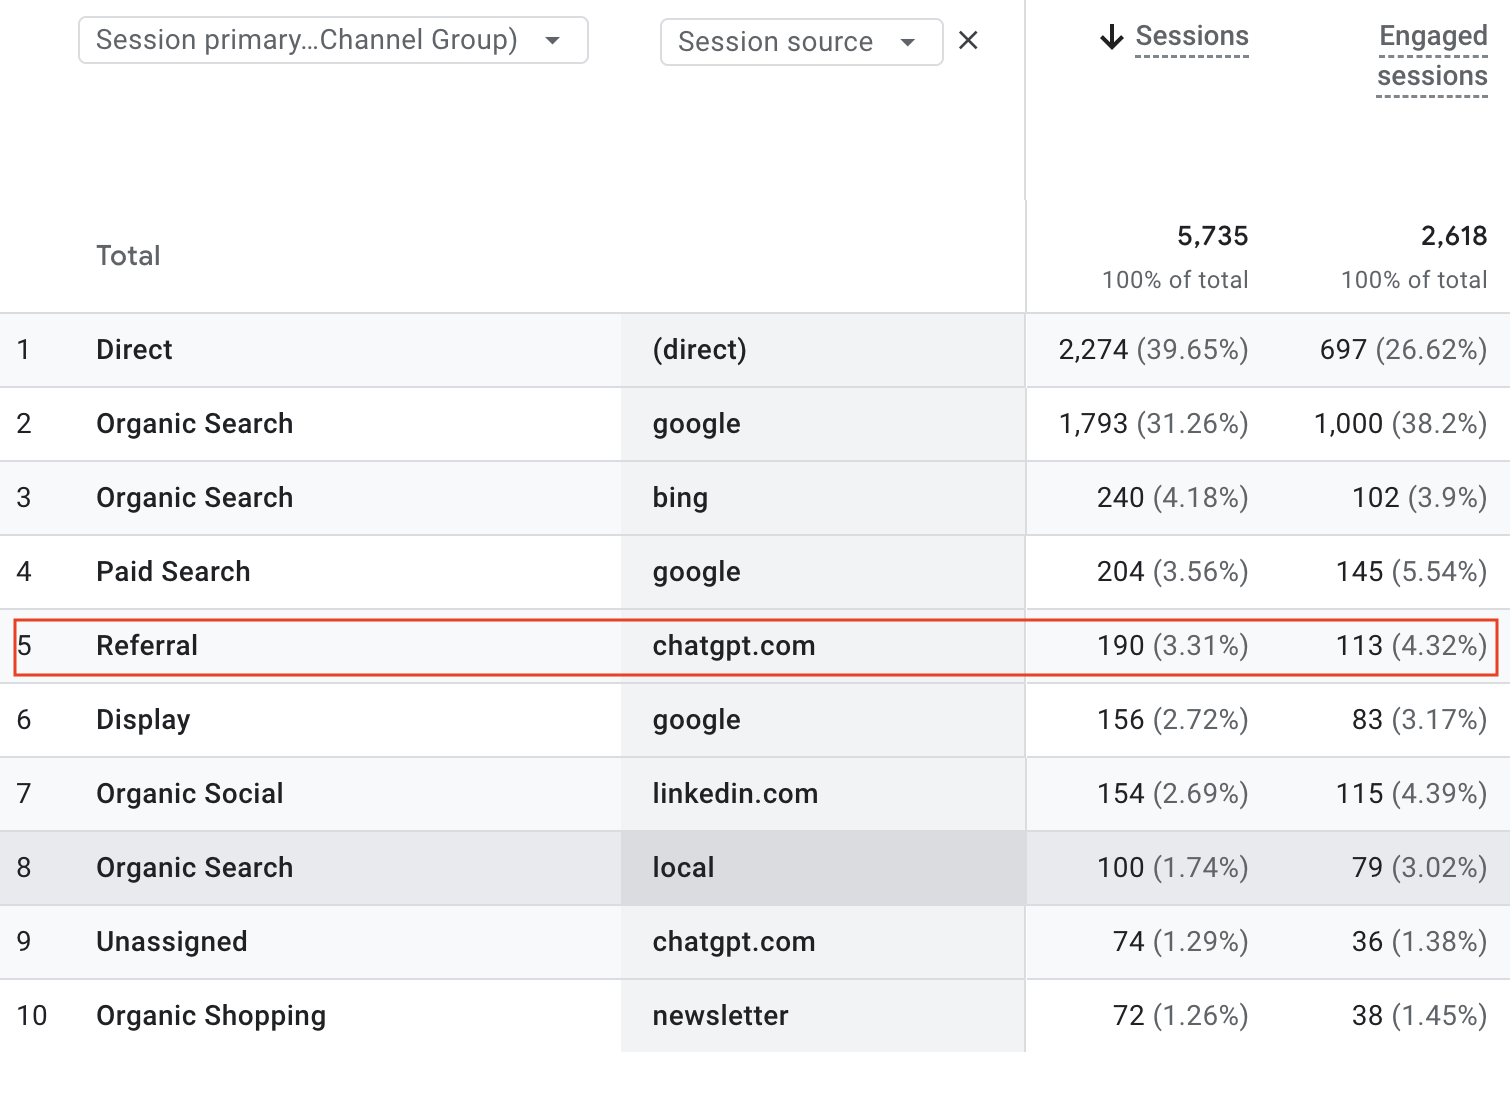
Moving deeper into the data, you can view your landing pages with the same filters to see which ones are receiving traffic from AI sources.. To view this, go to Reports > Engagement > Landing Pages and then add your filter. You can see it applied in the example image above. From there, analyze each page to understand what about that particular content is causing AI to favor it.
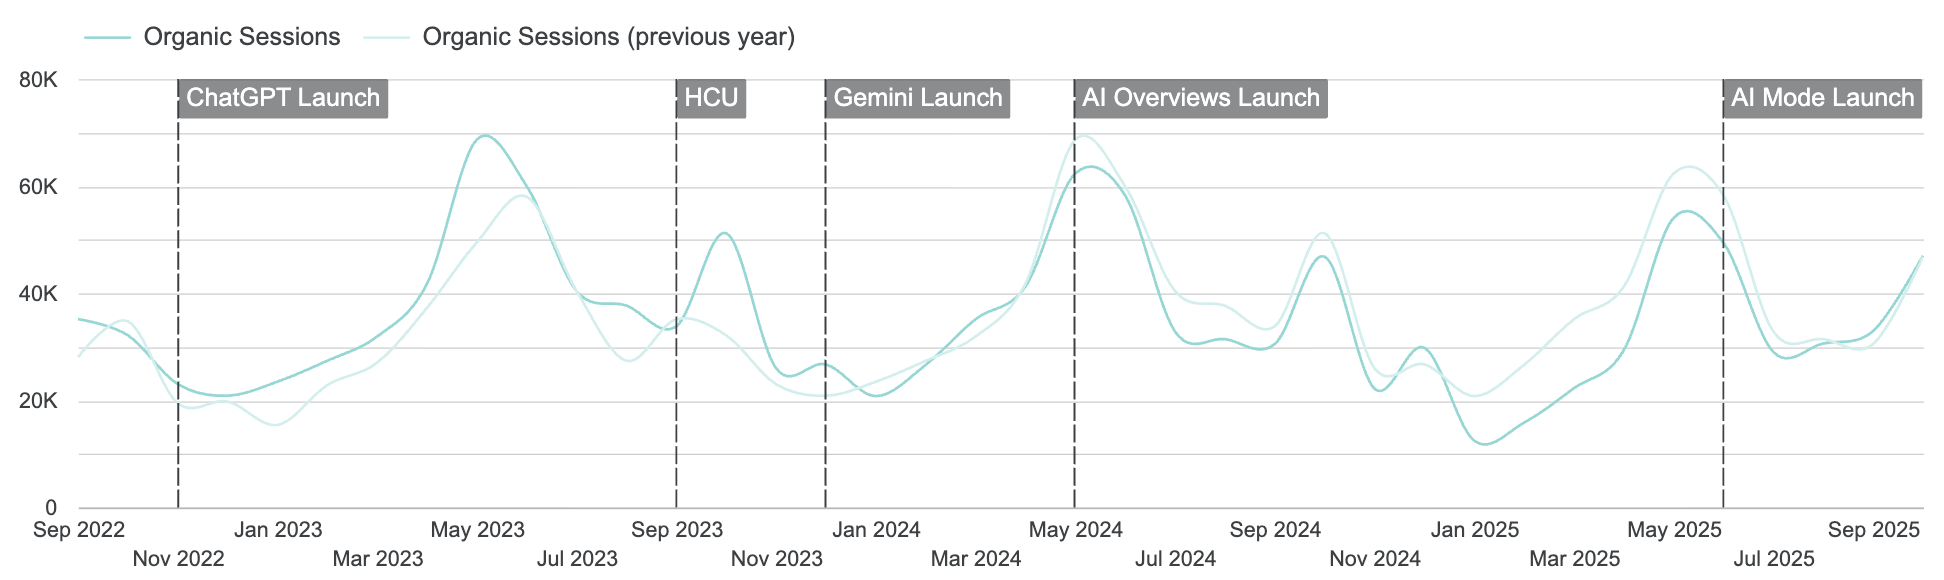
At this point, you can start asking questions like, “How has traffic been affected over the past few years?”
When ChatGPT launched in November 2022, adoption rapidly grew. By June 2025, not only will dozens of new tools exist, but AI will have become an integral part of Google AI Mode.
Creating a trend chart that aligns metrics like traffic, impressions, and conversions with major AI tool releases can uncover insights into how these changes have impacted your performance (as shown in the example below).
How Should I Deal With Increased Competition?
Let’s take a step back to the basic economics of supply and demand. Customers have more options right now: your company, your competitors, or simply doing nothing. This increased competition (supply) means that more companies are trying to pull in fewer customers (demand).
To add another factor to compete against, there are many others out there who now think they can handle their own marketing because of AI. While we all know the pitfalls of this approach, it’s still another factor for us to compete against.
As Sun Tzu wrote, “If you know the enemy and know yourself, you need not fear the result of a hundred battles.” So, as we set our sights on 2026, how do we create a winning strategy that puts us ahead of our competition?
What Data Should I Be Looking At?
We all wish we had a crystal ball to see into our clients' minds and our competitors' strategies. But since we lack that divine wisdom, we will have to settle for an old-fashioned SWOT analysis.
A SWOT analysis is a great way to analyze how you and your competitors fare in the market. And in addition to not only helping your own strategy, it can be used as a key part of brand storytelling.
Thankfully, AI has made gathering basic data for a SWOT analysis much faster. With the right prompts, AI tools can pull much of the foundational information in seconds. Start by asking the tools to provide a high-level SWOT analysis, then drill down into the specific areas you want to compare. No, it won’t do all the work for you, but it’s a strong launch pad for deeper strategic thinking.
When compiling your SWOT analysis, take time to review the following factors. These often highlight differentiators that clients notice most.
On-page word count: Are your competitors using more or fewer words to communicate their value? For example, if your service pages average 3,000 words while your competitors' sites average 1,500, then they may be doing a better job of communicating their value more concisely. It may be worth revisiting your on-page copy for clarity and focus.
Audience Targeting: Does your site speak directly to your target audience’s pain points and value propositions? Often, companies boast about their experience, but leave out the core value propositions against others in the market. If you’re selling me a car, I don’t care how long you’ve been in business; I care whether you have the make and model I’m looking for.
Brand Recognition: Is one brand more popular than another? This can be examined in both quality and quantity. Check whether your competitors’ directories and citations are updated, and make sure yours are too. Consistency and visibility across channels can have a major impact on perceived authority.
These are just a few initial points to get you started. But there is a lot more data that can be pulled in to strengthen your analysis.
Pro Tip: This is an excellent time to pull in any customer survey data you have. Customers often reveal what’s working (and what’s not) far more directly than analytics ever could.
If you’re still unsure where to start with your SWOT analysis, try using some of the free tools and AI prompts below.
Screaming Frog: Nothing beats a deep site crawl for understanding your website’s structure and identifying various metrics and dimensions about a page, like word count, image size, reading level, etc.
BuiltWith: This tool reveals the tech stack of a website. This tool will show what CMS, CRM, or other website integrations your competitors have, giving you an idea of their organizational infrastructure and capabilities.
- AI Prompts: Use AI tools to quickly analyze on-page content and find opportunities. For example:
Identify all of the keywords targeted on this webpage: [example.com]
Summarize the value propositions this webpage is providing.
How Do We Deal With These Macroeconomic Factors In 2026?
A mentor once told me, “A problem well understood is half solved.”
Understanding how macroeconomic trends (like inflation, cautious spending, the rapid rise of AI, and the surge in competition) impact your business strategy can feel complex, but there’s good news: clarity starts with data.
The data points we’ve reviewed are just the beginning. They serve as the foundation for getting ahead of these challenges and guiding you toward a well-defined 2026 marketing strategy.
As you continue to analyze and reflect, new insights will naturally emerge.. And while you may not have all the data you want, you'll begin identifying gaps and gain a clearer picture of your overall performance.
If you need help filling in those data gaps and setting a clear, data-driven path forward, reach out to the Workshop Digital team. We’re here to help you turn uncertainty into opportunity.