It’s a common question: How can I get real insight into what's happening on my website? Why are some people clicking and others not? Why is my conversion rate going up or down over time?
We are familiar with web analytics tools like Google Analytics that tell us how people get to our sites and what pages they view. But these metrics only tell part of the story. Pageviews and conversion rates answer the question, “What pages are people viewing on my site?” but not, “Why aren't more people converting?”
Enter heatmaps. A heatmap is simply an overlay of user interactions on a screenshot of a webpage. Warmer (red or orange) colors indicate greater activity. Cooler colors (green or blue) indicate less interest or activity.
Here's an example heatmap that shows where our website visitors click on a list of links. It's easy to see that some links are more popular than others.
Most heatmap tools anonymously record a few basic types of interactions. Let's look at each one with examples of how we use this information to improve one of our most important KPIs - online job applications.
Scroll Depth
How far down the page do visitors scroll? Do people even see the content below the fold or at the bottom of our webpage? How does user behavior differ between desktop and mobile devices?
Scroll depth heatmaps show the percentage of users that scroll to certain points on the page. Here's an example of our careers page. It's a very long page by most standards but we feel it is important to share our story, our core values, and our benefits with potential new employees before they apply.
The action we want them to take (submit an online job application) is almost at the bottom of the page. Normally, putting your primary conversion action at the bottom of a long page would harm conversion rates because visitors have short attention spans and don't like to scroll too far to find the info they need.
However, this scroll depth heatmap shows that 75% of visitors to this page scroll all the way down to see the open job positions. That's much better than we expected and indicates that visitors are highly motivated to find the information they need and apply online.
Compare that to our homepage where fewer than 50% of visitors scroll below the top hero section of the page. The majority of visitors never see the important content in the middle and at the bottom of our homepage. Not good!
On one hand, we could interpret this to mean that the majority of people find what they need "above the fold". In many cases, we don't care if people scroll all the way down the page if their questions are answered at the top.
Consider the goals of each page and your visitors' motivation before deciding if scroll depth is good or bad. Scroll depth maps provide incredibly useful data for marketers that are tempted to "squeeze one more thing" in to important pages. In many cases, a page becomes more effective when it contains less information and therefore fewer distractions.
In our homepage case, we have some work to do to increase the percentage of visitors that scroll down or re-prioritize the content above the fold so visitors don't skip over some important information.
Click Maps
Heatmap tools track clicks on desktop computers and taps on mobile devices.
Tracking clicks allows you to see which website elements are most important or appealing to your visitors. The results are often surprising and can reveal where visitors are finding (or not finding) the next step on their journey.
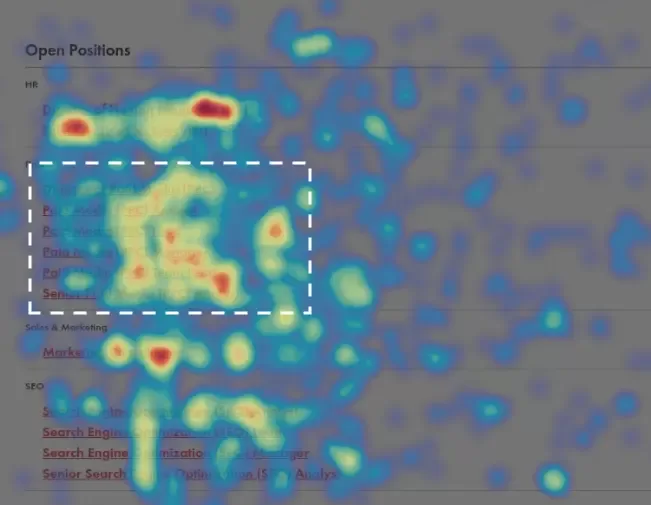
In the example below, the majority of clicks on our careers page are on the link to "check out our digital marketing jobs" - exactly the action we want visitors to take.

A little farther down the page, we can see which specific positions are clicked the most. More visitors are interested in the Marketing Coordinator and Talent Acquisition Specialist positions than our SEO and PPC analyst positions.
Mouse Movement Maps
Many people (myself included) are visual learners. I tend to hover my mouse over text and images as I’m scanning a web page. Mouse movement charts enable you to see where users move and hover their mouse pointer on a page. Of course this only works on desktop computers because tablets and smartphones don't have mouse pointers.
Mouse movements typically provide more information than just clicks. Some movement charts can highlight visual "scroll stoppers" that cause people to consider what they are seeing a little more closely even if they don't, or can't, click on it.
Here's the mouse movement chart for the same set of open positions on our careers page. See how there's a lot of movement and hover activity over the Paid Media (PPC) positions that don't translate to clicks in the click map above?
This could indicate some confusion or uncertainty when looking at 6 different levels of positions on our PPC team.
A little confusion is not surprising because we are asking prospective candidates to A) self-assess their own skills, and B) interpret our job titles based on what they see elsewhere in the industry.
We might get a higher click rate if we narrow down the visible options and place candidates in the right level after a brief skills conversation after they apply.
A homepage navigation example
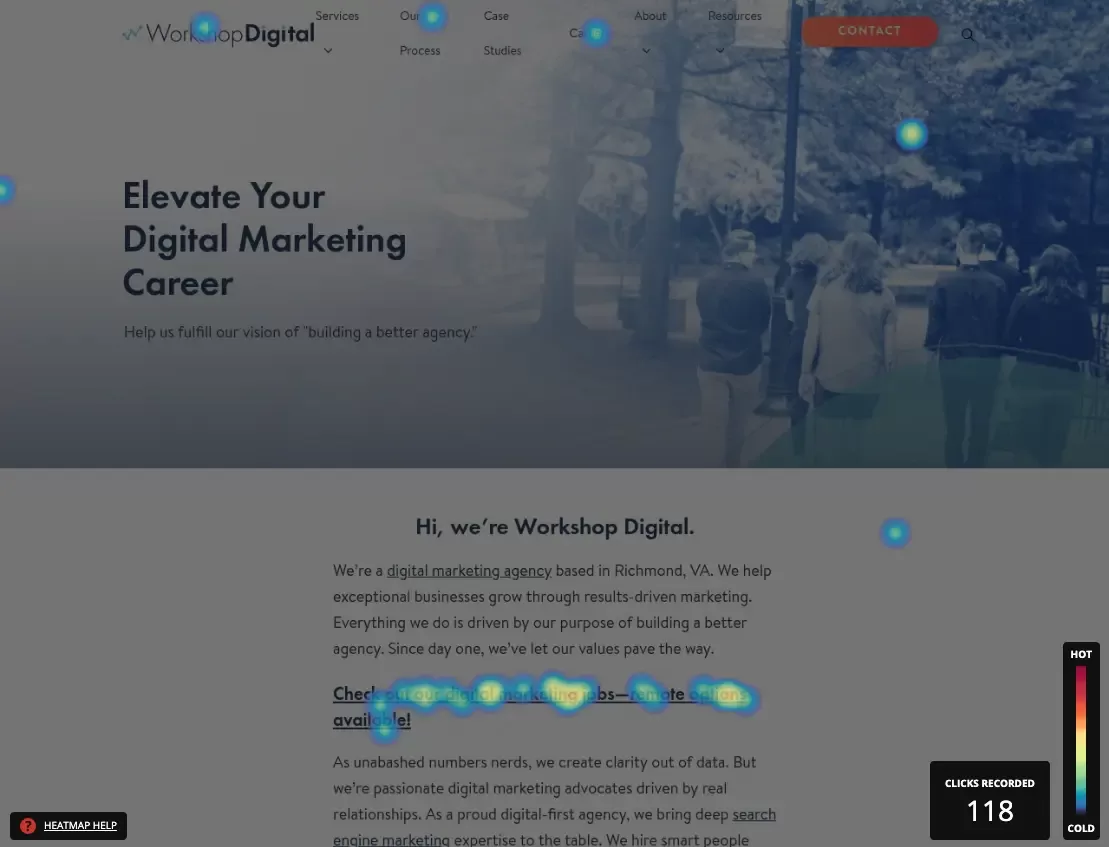
Here's another example from our homepage navigation. The click map (top image) shows more clicks on the "About" menu item. The mouse movement chart (bottom image) shows a LOT of hovering over our "Services" and "Resources" menu items.


So why aren't visitors clicking on our Services or Resources nav menu items? One hypothesis is that our visitors aren't ready to engage with deeper content at this early stage in their journey. If the "About" menu item is a first stop for the most visitors, perhaps we should show that information more prominently on our homepage.
Why heatmaps? Why now?
Marketers that only rely on Google Analytics are missing the qualitative feedback provided by users on your website.
Google Analytics is great at telling us a few basic things about engagement on a particular page such as:
How many visitors view a page and how long do they spend there?
What % of those visitors take a desired action?
How did the visitors arrive on the page and where they go next?
Heatmaps provide another layer of information about the user experiences that tells us what we need to know in order to improve the page’s performance:
Which content on the page is most appealing?
Do people scroll far enough down the page to see the most important information?
Which elements get the most clicks?
What might be getting in a customer's way?