
What is Power BI?
One of the biggest buzzwords and trends in Search Engine Marketing throughout 2018 has undoubtedly been Power BI, and for good reason. Power BI is a Windows-based analytics platform specifically designed for business analytics. Released in 2013, Power BI allows users to quickly and easily create interactive visualizations, dashboards, reports, and combine multiple data sets without having to rely on knowing anything about database administration or SQL. Users can painlessly upload and combine multiple data sets, and use the intuitive interface, to create tables, charts, and visualizations that allow for in-depth analysis that Excel would normally begin to stall out on. This can be used as a totally free source, although choosing the free package means that you will not be able to create cloud-based dashboards, however, free is still a considerably better option than the lowest level package for the comparable Tableau, which can quickly become a very costly endeavor for an individual. Moreover, I find that Power BI is a much more intuitive platform than Tableau, and the differences in features between the two are still minor enough at the moment that I’m fine using the free alternative.
There is one serious note though: Power BI only works on Windows. But don’t worry, we’ve got a solution for that at the end of this post.
To be honest, I’d rather not spend this blog post selling you on Power BI over Tableau. Instead, I’d like to focus on some of the benefits of incorporating a business intelligence platform and data visualization into your monthly analytics check-ups and strategy development.
How to Get Started with Power BI
Most of why I don’t really want to spend a whole lot of time getting into the basics and nitty-gritty of Power BI is because Wil Reynolds and his team at SEER Interactive have already done that, and they've done it pretty damn well.
So why reinvent the wheel?
Instead, you should start off by reviewing the videos in this Power BI Basics for SEO & PPC - YouTube Playlist to get an overview of what Power BI is, how to set it up, and how to bring your data sources into the program. It’s okay. I’ll wait.
Now that you got those basics down, let’s take a look at why utilizing a tool like this can really supercharge your search engine marketing efforts.
Data Sources Matter: SEO & PPC Data Sources for Power BI
In reality, you can pretty much analyze any data set that you’d like in Power BI. As search engine marketers, we rely on as many data sources as possible when developing strategies for our clients. This is one of the reasons that Power BI is such a great choice for SEM analysts. Normally, if we were to try to combine a year's worth of data from Google Ads, Google Search Console, and SEMRush (and more!), we’d be stuck with the slowest Excel sheet ever. We wouldn’t be able to really dig through and find the insights that we’re looking for, simply because Excel isn’t designed to handle that much data at one time.
Of course, we could always learn how to set up a database, then how to write SQL (which maybe you should anyway…), and then start digging through our sources to get some insights. But that’ll take a lot longer than just cleaning our sheets up, saving ‘em as CSV files, and pulling each into Power BI. And since we’re no longer limited by Excel’s max rows/columns, we’re able to start mashing things together and review a huge set of data without fear of Excel crapping out.
Cool, So what sources should I use?
This is heavily dependent on the type of analysis that you’d like to complete. In general, I would recommend grabbing a year’s worth of Google Search Console query data (Go to the new Search Console interface -> Performance -> Adjust date for a year -> Export with Total Clicks, Total Impressions, Average CTR), and a year’s worth of Google Ads data. I am not a fan of the standard reports, so I would recommend creating a custom report that you can use over and over again.
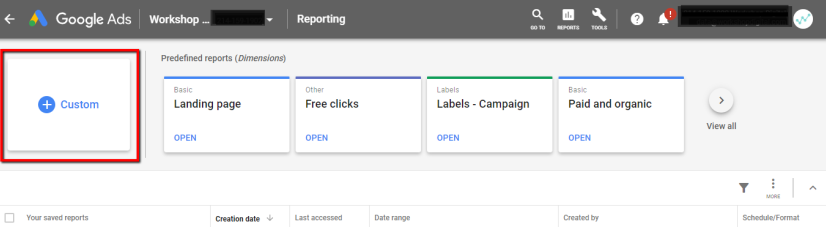
To do that, login into Google Ads, click Reports, then Custom, select Table, and start building your report. I typically include all of the following data points in no particular order:
- Search Terms
- Clicks
- Impressions
- Cost / All Conversions
- All Conversions
- All Conversion Rate
- Cost
- Average Cost
- Conversions
Now that you’ve built your report and saved it, you’ll be able to use this custom report in the future.
The last data source that I grab is from SEMRush. I usually just grab a keyword report so that I can see where my site ranks organically, as well as the average search volume for that keyword. To get this, you’ll want to login, drop your domain, then scroll to the Top Organic Keywords report. Export the whole thing as a CSV and we’re ready to start playing with and thinking about our data. Since we’re mostly concerned about keyword rank data, we could also potentially use an export from STAT. Or both. This is your choice, but I prefer SEMRush’s information because it generally includes a wider range of keywords than what my tracking in STAT may have been set up for.
What Next?
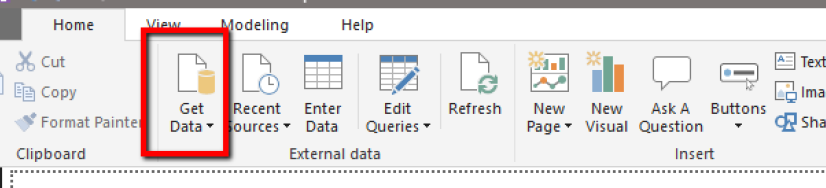
Now that you’ve got all your individual CSV files, you’re almost ready to rock. Next, you’ll want to clean up your sheets and make sure that you’ve set the right values for each column, removed unnecessary blank cells, and have named things appropriately. Then, once all of our sheets are clean, start adding ‘em into Power BI!
Once we’ve loaded our data sources in, we’ll need to create a relationship between each spreadsheet, as explained in the SEER videos mentioned above. As a heads up, Power BI can automatically recognize and create a relationship between CSVs with identical column names. Instead of having to specifically identify the relationship between sheets in the menus of Power BI, we can just set the column names that we want to our data to hinge on before we import. This isn’t a necessary step, but it could save you an extra minute or two. Otherwise, simply select Manage Relationships, New, and bring in the CSV files.
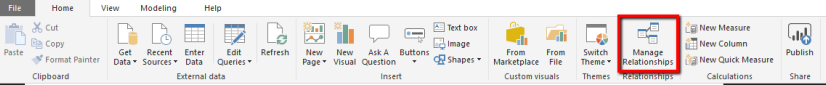
Then, choose your keyword column in both data sets, set the Cardinality to 1:1, and Cross Filter Direction to Both. Once we’ve built our relationships hinged on the keyword column for each sheet, we’re ready to start analyzing that data.
Analyze That Data
Now that we’ve got everything loaded in and our relationships between data sets built, it’s time for us to start taking a look at specifics. The beauty of working with Power BI is that there is a huge number of insights that can be developed by reviewing our data through multiple sources, hinged on our search terms. The following are just three of the ways that I have found to be most helpful for me as a marketer, and in creating joint strategies for both paid and organic campaigns. These aren’t the only ways we use Power BI, but in this post we’ll just be exploring the following strategies:
- Identifying converting keywords for AdWords that we don't rank organically for
- Identifying areas where Organic ranks well, but Paid doesn't compete
- Identifying wasted ad spend
Let’s take a look at how to accomplish this.
Strategies using Power BI for PPC & SEO
1. Identifying converting keywords for Google Ad Search Terms that we don't rank organically for
The first step here is to make sure all of our data is cleaned and loaded in. For this task, we’re going to need our SEMRush rank data, a year of Google Search Console data, and a year of search term data from Google Ads. We want to build our data table based off of our Search Terms, so this should be the first column, and the hinge that the relationship between all three sheets is built off (if that wasn’t clear enough already).
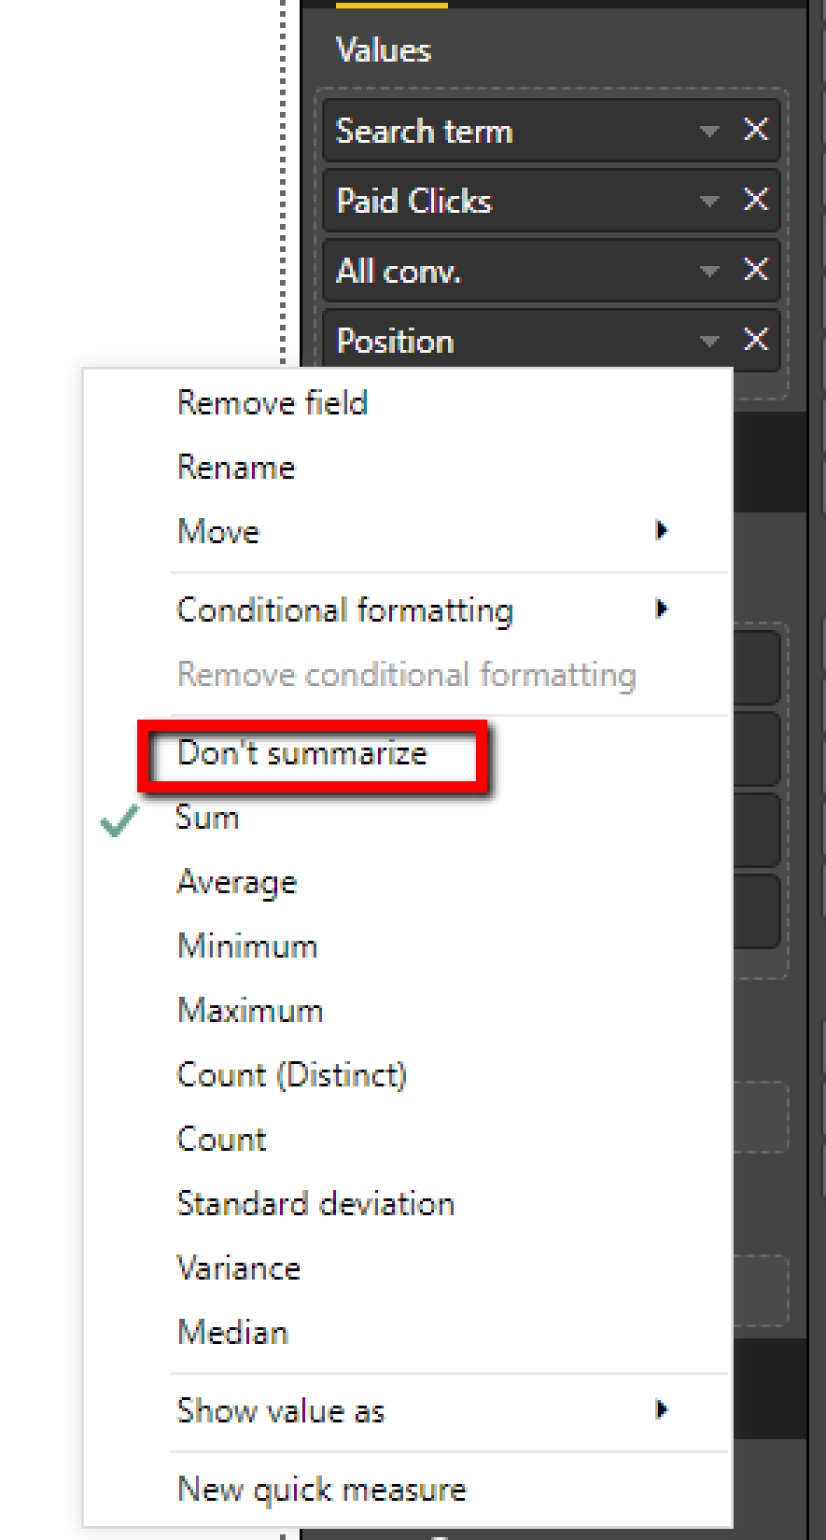
Next, start loading in metrics. We’re going to start with Search Terms, but at the end, you should have each of the following metrics as columns:
- Search Term
- All Conversions
- Cost / All Conversions
- Ranking Position
Sometimes Power BI defaults to counting or summing columns. If that’s the case, go to the Values menu on the right-hand side, choose the value you need to adjust and set it to ‘Don’t Summarize’.
Once you’ve got all that table built, we’ll likely want to add some filters and make sure that we’re not looking at any search terms that have no conversions, because there is likely lots of those. So we’ll add a filter into only show conversions > 1.
Remember, our end goal is to find Ads keywords that convert that we do or do not rank for since we can pull back our ad spend for each keyword that we are ranking for. This means that we’ll want to prioritize our SEO efforts to optimize for those converting keywords that we don’t rank for. The rationale is pretty simple here; Ads is giving us insights into how our ideal customers search, and we can use that data to enhance our ROI from Organic Search by targeting those search terms. This can be a pretty easy way to end the conversation of what is or is not allowed on the website. Basically, “this keyword is making us money” should be enough to convince your stakeholders to let you add it to the site.
Anyway, in this example, we’ve got a few high converting keywords that have incurred a decent cost. We don’t rank for any of these keywords at all, demonstrated in the screenshot below.
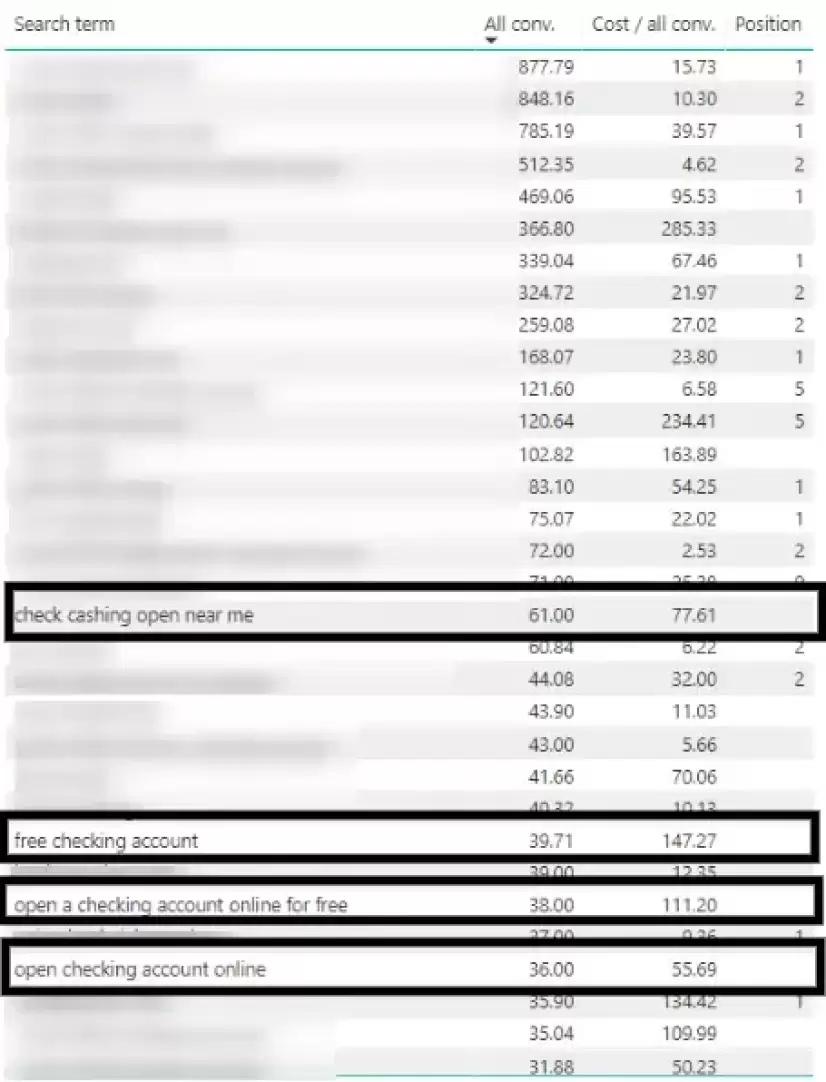
So, if we had been ranking organically for these terms over the last year, we could have likely saved somewhere in the ballpark of $400 and may be received about 175 conversions from Organic traffic. While this may not be a huge sum of money for this particular client, we can still look at ranking for these particular keywords as a new goal for SEO since we know that they are very valuable for our client, even if they’re not expensive. Since so much of SEO is semantically based as well, there’s a good chance that ranking for ‘open a free checking account’ will be a goldmine for our client because we’re picking up a lot of very closely related searches too (Spoiler: it is.).
2. Identifying areas where Organic ranks well, but Paid doesn't compete
Now that we’ve got an idea of where Paid pulls more weight than SEO, we can flip this around and figure out where Organic is pulling more weight than Paid. This type of analysis can help us identify areas that Paid Search can help reinforce Organic search since we know that if a brand shows up twice on SERP that we’re somewhere around 90% more likely to get the click from a searcher. To do this, we’re going to want to load in the following dimensions:
- GSC Query
- Organic Clicks
- Paid Clicks
- All Conversions
- Cost All Conversions
This should give us a table that looks similar to the one below.
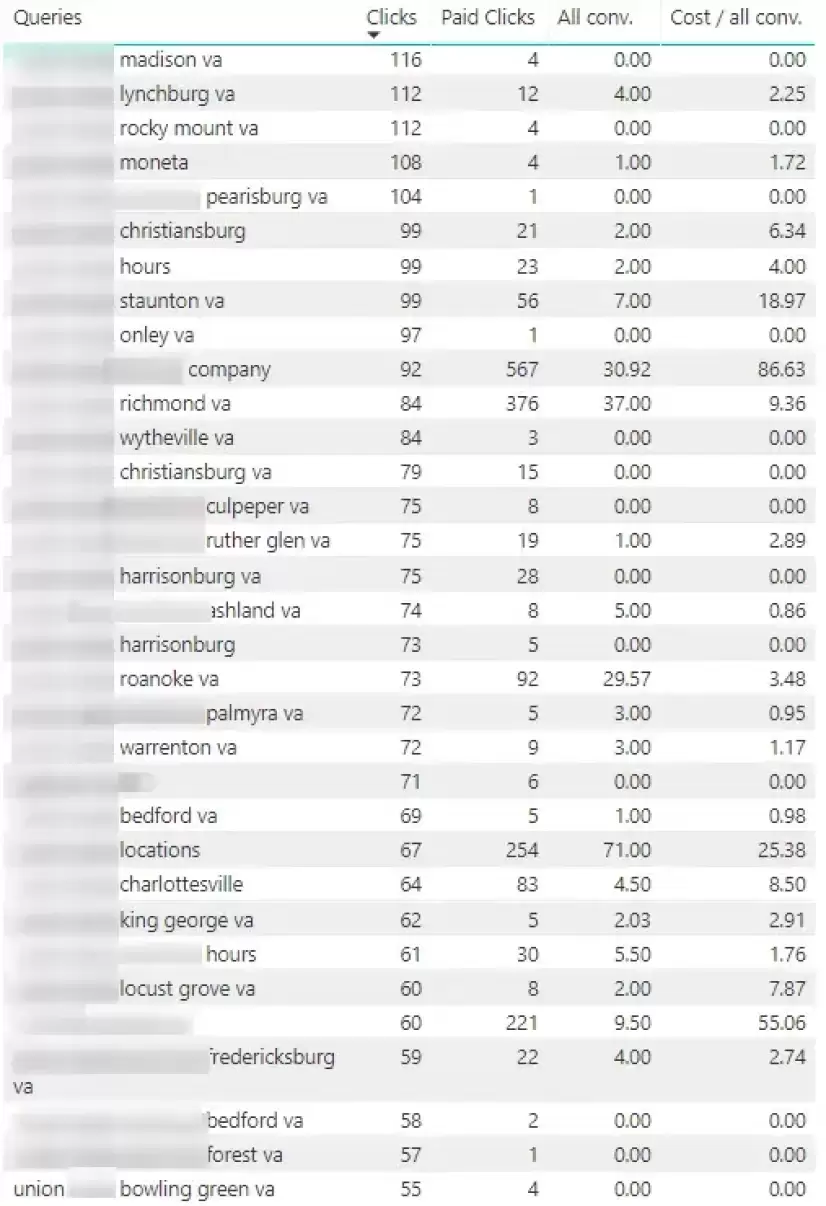
One thing you might have noticed already is that this is a very heavily brand-oriented company. They get a ton of organic traffic specifically from their [blurred out] brand name, and a tremendous amount of traffic from “[blurry] brand name ______ va” searches. But since we’re mashing our organic clicks up to our paid conversions, we’re able to see that these local searches aren’t just producing traffic -- we’re actually getting a lot of conversions too. It’s just that we’re not heavily bidding on these terms, so there’s a chance that we could see even more of a return if we shifted that $400 in the budget that we identified in our previous example to focus on these local based queries.
3. Identifying wasted ad spend
The final example that we’ll go through in this post is how to identify absolutely wasted ad spend. Truthfully, we don’t exactly need Power BI to accomplish this, but we’ve already cleaned our spreadsheets and loaded in our data. So why not just take the time to analyze what we’ve got?
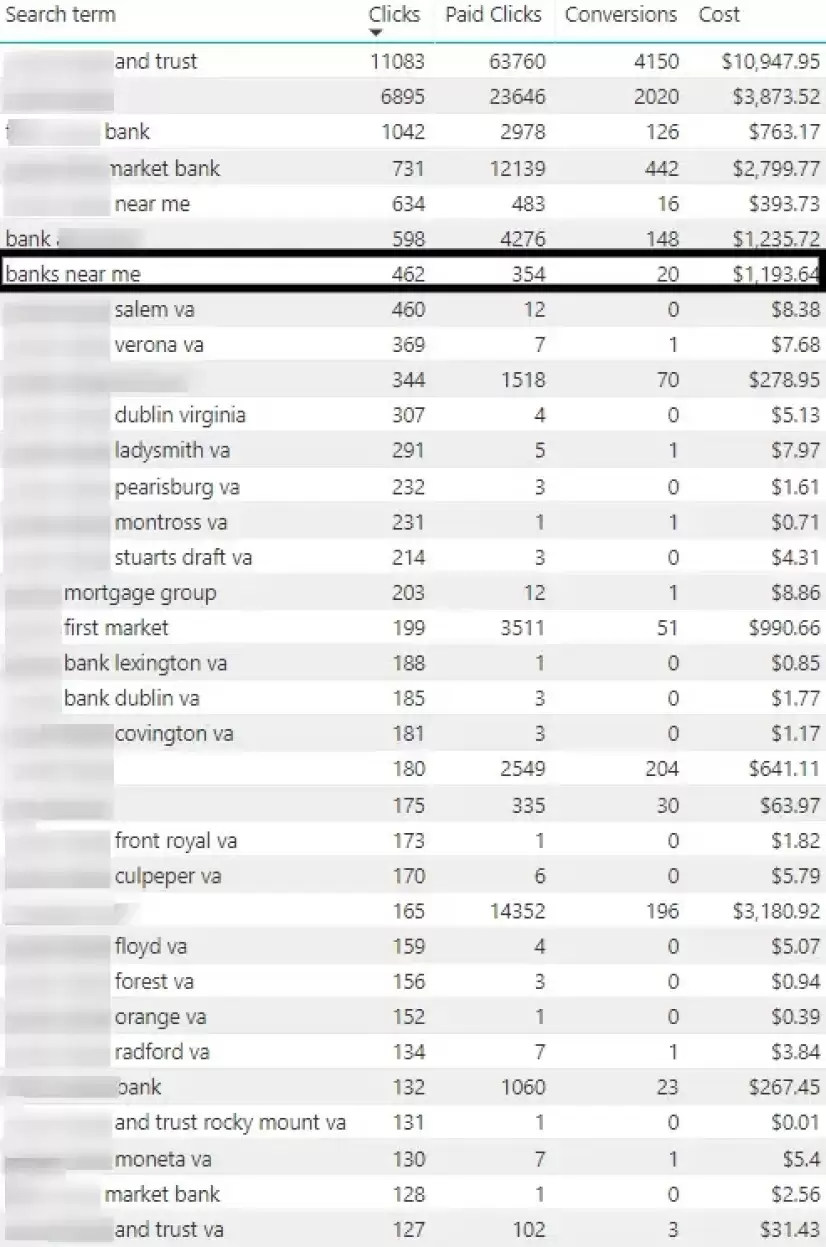
Let’s get started. We’ll want to load in the following data points:
- Search Term
- Organic Clicks
- Paid Clicks
- Conversions
- Cost
We’ll then go ahead and sort descending by Organic clicks. The idea is that we want to look for search terms that we’re getting a lot more organic clicks than paid, and are keywords that we’re not receiving a ton of paid clicks for but are paying a lot for this. For example, right off the bat, we can see that this client has spent almost $1,200 on one keyword over the last year. This keyword definitely did produce a few conversions, but this is a prime example of wasted ad spend since we would likely be getting those clicks even without paying for them.
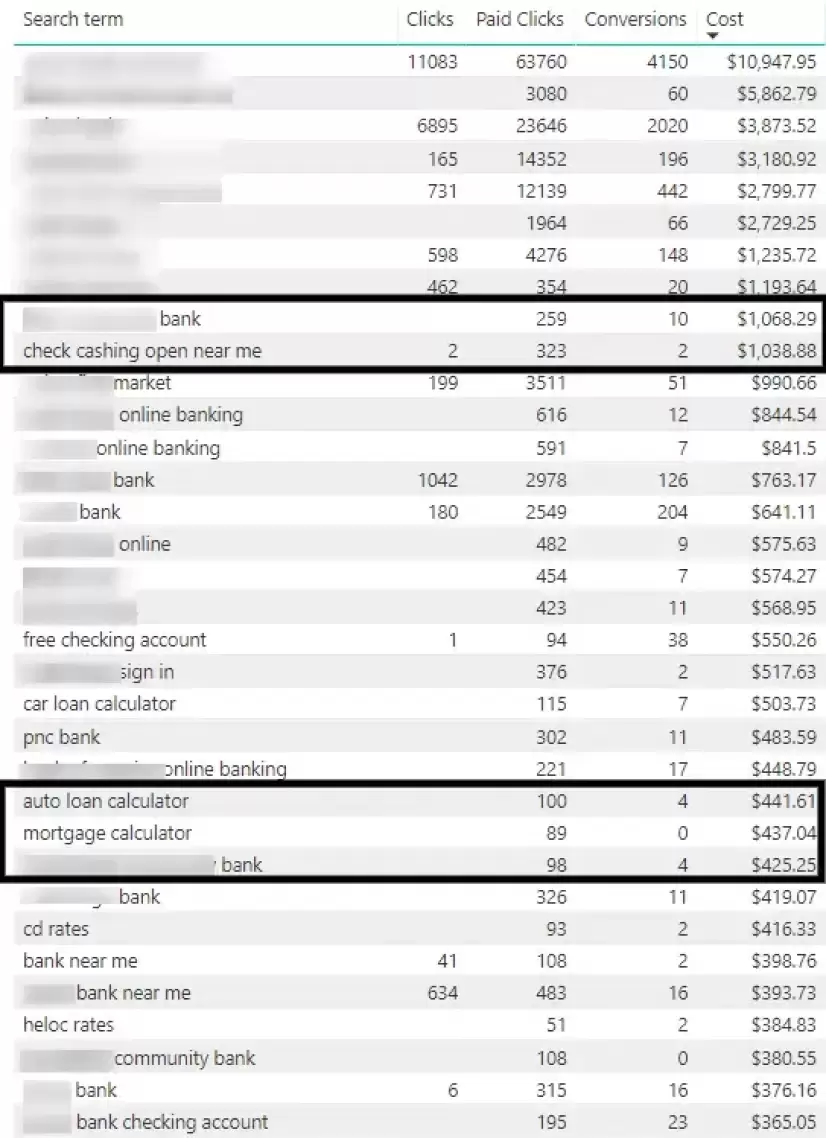
We don’t always have to view just by Organic Clicks, either. In the example below, sorting by Cost allows us to look at the cost leaders for the site, and since we’ve merged the sheet by Search Terms we may not always see Organic Traffic figures pulled in, but we will be able to see search terms that we’ve spent a ton of money on with little to no return. For example, we’ve spent just shy of $3,500 on the 5 highlighted keywords in the example below, but we’ve only received 20 conversions from a total of close to 870 paid clicks. This suggests that we may not want to further bid on these keywords, as there are many others that produce significantly more conversions at a total lower cost.
How can I do this without Power BI?
So, it’s true, you don’t exactly need Power BI to complete a lot of the analysis that we’ve talked about in this post. It really just comes down to how large your data sets are, and how deep the analysis you’d like to complete is, and whether you need to visualize your data or not. If you’re looking to reveal converting keywords that we do or do not rank for, or high/low converting keywords that we’re not organically optimized to support, looking for wasted ad spend, or looking for overlaps based on where Organic doesn’t rank well and Paid isn’t competing, then we can actually still use Excel.
“So this is great”
That’s exactly how I felt after hearing Wil Reynolds speak about how Power BI has revamped the way SEER thinks about and processes data. Being able to review this information outside of a silo has allowed us to create very in-depth strategies for our clients, as well as allow for continual refinements in campaigns, and helps us set far-reaching goals with huge implications for our clients’ accounts. There are a lot of different ways that we can utilize Power BI to extract insights, but I’d have to say that, as an industry, we’re still figuring out just how useful this can be for us.
How are you using Power BI? We’d love to hear all about your approach! Tell us how @workshopmktg.
Stay tuned for our follow up blog post about Power BI & Search Engine Marketing as well. In that post, we will further examine some of the capabilities and visualizations that Power BI offers us and how we can apply that directly to search engine marketing.
