
You've got Google Analytics open in one tab. The numbers look... fine. Traffic is up, bounce rate is doing whatever bounce rate does, and somewhere in a dashboard full of graphs, a pie chart is judging you silently.
But here's the thing: none of it tells you why someone rage-clicked your CTA button four times before leaving forever. Or why visitors keep dropping off on the page you spent three weeks perfecting. Or what on earth is happening on mobile.
That's the gap… and it's a big one.
Behavioral analytics exists because website data has always been great at telling us what happened and terrible at telling us why. And the market agrees this is a problem worth solving in a big way. According to Grand View Research, the global behavioral analytics market was valued at $4.13 billion in 2024 and is projected to hit $16.68 billion by 2030, growing at a CAGR of 26.5%. That is not a niche concern. That is a full-blown industry stampede.
Enter Microsoft Clarity.
Clarity is a free behavioral analytics tool built by Microsoft that shows you the human side of your website data. We're talking heatmaps, session recordings, AI-powered insights, and a front-row seat to how real people actually use your site, including all the scrolling, hesitating, rage-tapping, and rage-quitting in between. And yes, free means free. No sneaky upsells, no traffic limits, no "you've hit your monthly quota" emails of doom.
Since launching in late 2020, Clarity has grown into a widely used behavioral analytics platform. According to Microsoft Learn, Clarity now processes more than 1 petabyte of data from over 100 million users every single month. For context, 1 petabyte is roughly 500 billion pages of text. The tool is not playing around.
And in 2026, Clarity isn't just watching your human visitors anymore. It has evolved to track how AI systems, like ChatGPT, Copilot, and Gemini, are crawling, reading, and citing your content too. Because apparently your website now has two audiences, and only one of them has opposable thumbs.
In this guide, we're breaking down everything you need to know about Microsoft Clarity: what it is, what it does, how it works, how it stacks up against Google Analytics, and why it might just be the most underrated tool in your marketing stack right now.
What Is Microsoft Clarity?
Microsoft Clarity is a free behavioral analytics platform from Microsoft that helps website owners understand how users actually interact with their site through heatmaps, session recordings, funnels, and AI-powered insights.
Unlike traditional analytics tools that focus mostly on traffic metrics, Clarity is designed to visualize behavior (similar to Hotjar). It shows where users click, how far they scroll, what they ignore, where they get stuck, and where they abandon a page entirely.
The platform launched publicly in 2020 after originally being developed internally by Microsoft to study user behavior across products like Bing. Today, Clarity is used by marketers, UX teams, developers, ecommerce brands, and content teams to identify friction points and improve website experiences without relying entirely on assumptions or aggregate analytics data.
One of the biggest reasons Clarity gained traction so quickly is simple: Microsoft made the entire platform free. There are no traffic caps, limited recordings, or locked premium features. Heatmaps, session recordings, funnels, integrations, and AI tools are all included by default.
That matters because behavioral analytics platforms have historically had a habit of turning into "please upgrade to unlock literally anything useful" software remarkably fast.
Clarity went in the opposite direction.
Install the tracking script, wait a bit, and suddenly you can watch anonymized user sessions, see where visitors rage-click, identify dead zones on a page, and spot the exact moments where people quietly lose patience and leave.
And lately, Clarity has started advancing beyond traditional UX analytics altogether.
In 2026, websites will no longer be dealing with just human visitors. AI systems are crawling, summarizing, citing, and learning from web content constantly. Clarity now includes AI bot activity reporting that shows which automated systems are accessing your site, how often they appear, and what content they interact with.
Which sounds futuristic until you realize your website is probably already being read by ChatGPT, Copilot, Gemini, Perplexity, and a small army of bots you've never heard of. Your site no longer has just a human audience. It has an AI audience too.
Is Microsoft Clarity Free?
Yes. Completely. Microsoft Clarity has no paid tier, no traffic limits, and no locked premium features. Every user gets access to heatmaps, session recordings, funnels, AI insights, and integrations at no cost.
Which honestly still feels suspicious in 2026, but here we are.
What Does Microsoft Clarity Do?
Clarity is built to answer a deceptively simple question: what are people actually doing on your website?
Not what page they landed on. Not how many sessions you had last month. Not whether your bounce rate went up 2.3% while everyone on LinkedIn pretended to know what that means.
What are users actually doing?
Are they scrolling? Clicking? Getting stuck? Ignoring your CTA entirely? Rage-clicking a button that looks clickable but isn't? Quietly abandoning your checkout page halfway through because your mobile experience turned into a tiny thumb-based obstacle course?
This is where Microsoft Clarity becomes genuinely useful.
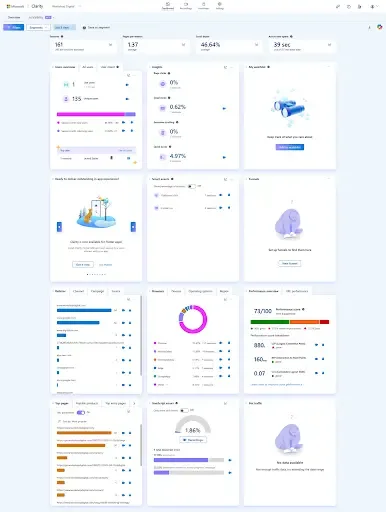
Instead of relying entirely on traffic reports and aggregate analytics data, Clarity gives you a visual layer on top of user behavior. You can watch anonymized session recordings, analyze heatmaps, identify frustration signals, connect behavioral patterns to Google Analytics data, and use AI-powered summaries to spot trends much faster.
The result is a much clearer picture of how people experience your website in the real world, including all the weird, frustrating, unpredictable behavior traditional analytics platforms usually flatten into charts and percentages.
Session Recordings
Session recordings are one of Microsoft Clarity's most useful features because they let you watch anonymized replays of real user visits to your website.
You can see where users move their mouse, what they click, how far they scroll, where they hesitate, where they get frustrated, and where they eventually leave. Clarity tracks behavior across desktop, tablet, and mobile devices, which is important because mobile users have an impressive ability to uncover UX problems nobody noticed during testing.
This is usually the moment behavioral analytics finally clicks for people.
Traditional analytics platforms can tell you that users abandoned a page. Session recordings show you why they abandoned it.
You might discover things like:
users repeatedly clicking an image that is not actually clickable
a mobile menu covering your CTA button
visitors getting stuck halfway through checkout
rage-clicking on broken page elements
This kind of visibility is incredibly useful for SEO, CRO, and UX optimization because user frustration rarely exists in isolation.
From an SEO perspective, poor user experiences often lead to shorter sessions, quickbacks to search results, and weaker engagement overall. If visitors land on a page from Google search and immediately struggle to navigate the content, they are significantly more likely to leave without interacting further.
For CRO teams, session recordings make conversion problems much easier to diagnose. Instead of guessing why users abandon a signup form or checkout process, you can literally watch the friction happen in real time.
And for UX teams and developers, recordings help surface usability problems that are difficult to catch through standard QA testing alone. Real users do unpredictable things. Ultimately, a lot of optimization work comes down to identifying the tiny moments where confusion starts building before a visitor decides the experience is not worth the effort.
One of the reasons Clarity's implementation works so well is that it automatically flags sessions with frustration signals like rage clicks, dead clicks, excessive scrolling, and quickbacks. That means you do not need to manually watch hundreds of recordings hoping to stumble across something useful.
Clarity surfaces the interesting sessions first.
And in 2026, when traffic journeys are increasingly fragmented across search engines, AI assistants, Reddit threads, social media platforms, and referral ecosystems, understanding what happens after someone lands on your site matters a lot more than traffic volume alone.
Heatmaps
If session recordings help you understand individual user behavior, heatmaps help you spot patterns at scale. Instead of replaying one visit at a time, heatmaps aggregate interaction data across thousands of sessions and turn it into a visual representation of attention and engagement. You can quickly see which parts of a page attract the most interaction, how far users scroll, and which sections barely get noticed at all.
Microsoft Clarity includes three primary heatmap types:
click maps
scroll maps
area maps
And this is where a lot of assumptions about website performance quietly fall apart.
A landing page that looks perfectly balanced during a design review might reveal that nobody scrolls past the hero section. A CTA you considered obvious may barely get interacted with. A beautifully designed sidebar could turn out to be completely invisible on mobile devices.
Heatmaps are especially useful because they reveal the gap between intended behavior and actual behavior.
You may think visitors are carefully reading your content top to bottom. In reality, they might be skimming headlines, skipping entire sections, and abandoning the page right before the information you actually wanted them to see.
That kind of visibility makes it much easier to identify weak layouts, content bottlenecks, distracting elements, and pages that simply are not guiding attention effectively.
One of Clarity's biggest advantages here is simplicity. Heatmaps are generated automatically once the tracking script is installed, with no extra tagging or setup required. Which means you spend less time configuring analytics software and more time discovering that users have somehow turned your FAQ accordion into an unintended stress test.
Insights Dashboard
Not every usability problem announces itself dramatically. Most of the time, users do not fill out a feedback form explaining exactly why they got frustrated and left your website. They just leave. Quietly. Efficiently. Sometimes in under ten seconds.
Microsoft Clarity's Insight Dashboard is designed to automatically surface those friction points.
Instead of forcing you to sift through endless recordings looking for problems manually, Clarity identifies behavioral patterns associated with frustration, confusion, or failed interactions and groups them into easy-to-spot signals.
Some of the most useful include:
Rage clicks: where users repeatedly click the same element out of frustration
Dead clicks: where users click something that does not respond
Quickbacks: where users immediately return to search results or the previous page
Excessive scrolling: often signals difficulty finding information
This is where Clarity starts feeling less like a passive analytics tool and more like a diagnostic system for your website experience.
A page with unusually high rage clicks may indicate broken functionality or a misleading design. Dead clicks often expose elements that look interactive but are not. Quickbacks can reveal pages that fail to match visitor expectations almost immediately.
And because these insights are aggregated automatically, patterns become visible much faster than they would through manual analysis alone.
As websites become more complex and traffic sources become increasingly fragmented across search engines, AI assistants, Reddit threads, social platforms, and referral ecosystems, manually identifying friction at scale becomes increasingly unrealistic.
Clarity helps narrow the search. Or, put differently: it points directly toward the parts of your website most likely to be quietly annoying people.
Google Analytics Integration
Microsoft Clarity works especially well when paired with Google Analytics because the two platforms solve very different problems.
Google Analytics is excellent at reporting numbers. It tells you how many users visited a page, where they came from, how long they stayed, and whether they converted. What it usually does not tell you is why any of that happened.
That is where Clarity comes in.
The native Google Analytics integration connects behavioral data with traffic and conversion data, making it much easier to understand what users were actually experiencing before they bounced, converted, or abandoned a page.
For example, Google Analytics might show that a landing page has unusually high drop-off rates on mobile devices. Clarity helps explain whether users were struggling with navigation, missing important content, getting stuck on form fields, or abandoning the experience entirely because the layout became painful to use on smaller screens.
The same applies to conversion analysis.
A checkout funnel may look perfectly healthy in a traditional analytics dashboard until session recordings reveal users repeatedly hesitating at a specific step or rage-clicking a broken button that nobody noticed internally.
Together, the two platforms create a much more complete picture of user behavior.
Google Analytics answers:
What happened
Where users came from
Which pages performed best
Microsoft Clarity answers:
How users behaved
Where friction appeared
What likely caused the outcome
Used together, the two platforms close a gap that has existed in analytics for years: understanding not just what users did, but what they experienced before they did it.
AI-Powered Insights
One of the biggest problems with behavioral analytics is not collecting the data. It is finding the time to analyze it. Watching a handful of session recordings is useful. Watching hundreds of them starts feeling less like optimization work and more like accidentally signing up for a second full-time job.
Microsoft Clarity tries to solve that problem with AI-powered insights built directly into the platform through Copilot.
Instead of manually reviewing large volumes of recordings and heatmaps, Clarity can summarize behavioral patterns automatically, highlight recurring friction points, and identify trends across groups of sessions much faster than a human realistically could on their own.
That changes the workflow significantly.
Rather than asking: "What happened in this one session?"
You can start asking: "What patterns keep showing up across hundreds of sessions?"
For example, Clarity might identify that users consistently hesitate before completing a form, repeatedly abandon a specific checkout step, or struggle with navigation on mobile devices. Instead of uncovering those issues one recording at a time, the platform surfaces the broader pattern automatically.
This becomes especially useful for smaller teams that do not have dedicated analysts or UX researchers constantly reviewing behavioral data.
Because the reality is that most teams already have more data than they know what to do with. The bottleneck is usually interpretation, prioritization, and figuring out which problems actually deserve attention first.
Clarity's AI features help shorten that gap considerably.
Not by replacing human analysis, but by helping teams find the important signals faster before they disappear into an ocean of recordings, dashboards, tabs, spreadsheets, screenshots, Slack messages, and "we should probably look into this later" conversations.
Microsoft Clarity and the Rise of AI Visibility
For most of the internet's history, website analytics focused almost entirely on human behavior. How many people visited your site? Where did they come from? What did they click? Did they convert?
But the web is changing quickly.
AI systems like ChatGPT, Copilot, Gemini, Perplexity, and Claude are increasingly becoming part of how people discover information online. Instead of simply sending users to websites, these systems often summarize, interpret, recommend, and cite content directly inside AI-generated responses.
Which creates a completely new analytics problem. Your content can now influence answers without necessarily generating a click.
That means visibility itself is starting to matter separately from traffic, and traditional analytics platforms were not really designed for that world.
Microsoft Clarity has started evolving directly into that gap with features focused on AI bot activity and AI citations.
AI Bot Activity
One of the stranger realities of the modern web is that a growing percentage of your audience is no longer human. AI systems constantly crawl websites to retrieve information, summarize content, generate answers, train retrieval systems, and surface recommendations inside AI-powered experiences. In many cases, this activity happens long before a real person ever visits your site directly.
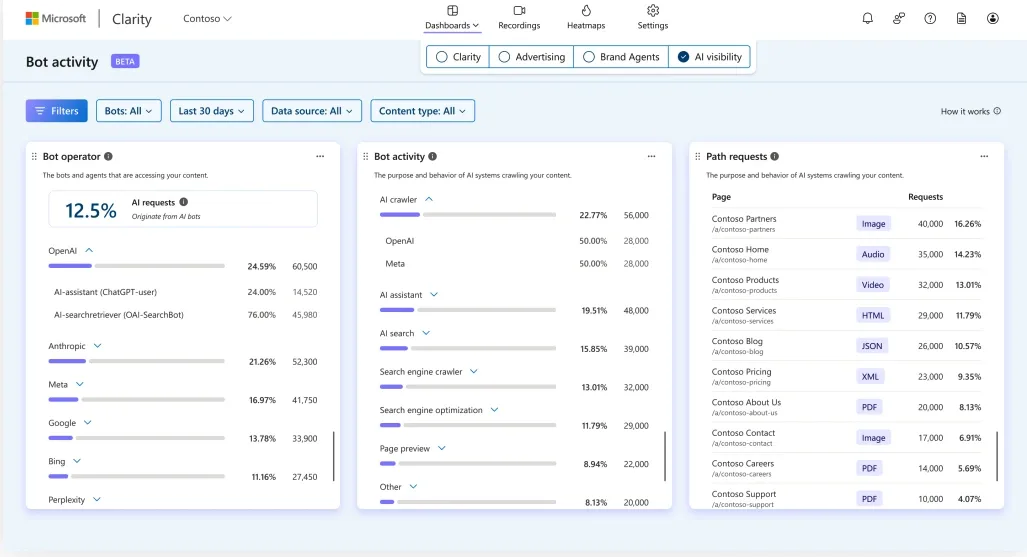
Microsoft Clarity's AI Bot Activity (released in January 2026) reporting is designed to make some of that behavior visible.
The feature shows which automated systems are accessing your website, how frequently they appear, which pages they interact with, and how AI-related traffic patterns change over time. That includes activity from systems connected to tools like ChatGPT, Copilot, Gemini, and other AI-driven search or answer platforms.
For years, website owners mostly thought about bots in terms of spam traffic, search engine crawlers, or the occasional mysterious scraper hammering a server at 3 a.m.
AI crawlers change the conversation entirely.
These systems are not just indexing your pages. Increasingly, they are interpreting your content, summarizing it, and potentially using it to shape answers shown somewhere else.
That creates a new layer of visibility that most traditional analytics tools were never built to track.
For publishers, marketers, and SEO teams, AI Bot Activity reporting helps answer questions that are becoming increasingly important:
Which AI systems are accessing your content most often?
Which pages attract the most AI crawler activity?
Is AI visibility increasing over time?
Are certain types of content being surfaced more frequently than others?
While AI traffic is still advancing, one thing is already becoming clear: websites are no longer interacting only with human readers and traditional search engines. They are interacting with AI systems constantly, too.
Clarity is one of the first major free (emphasis on the free) analytics platforms actively trying to expose that layer instead of pretending it does not exist.
AI Citations
AI visibility becomes even more interesting once citations enter the picture, because one of the biggest shifts happening in search right now is that content no longer needs to generate a click to influence a user decision (welcome to the zero-click search world).
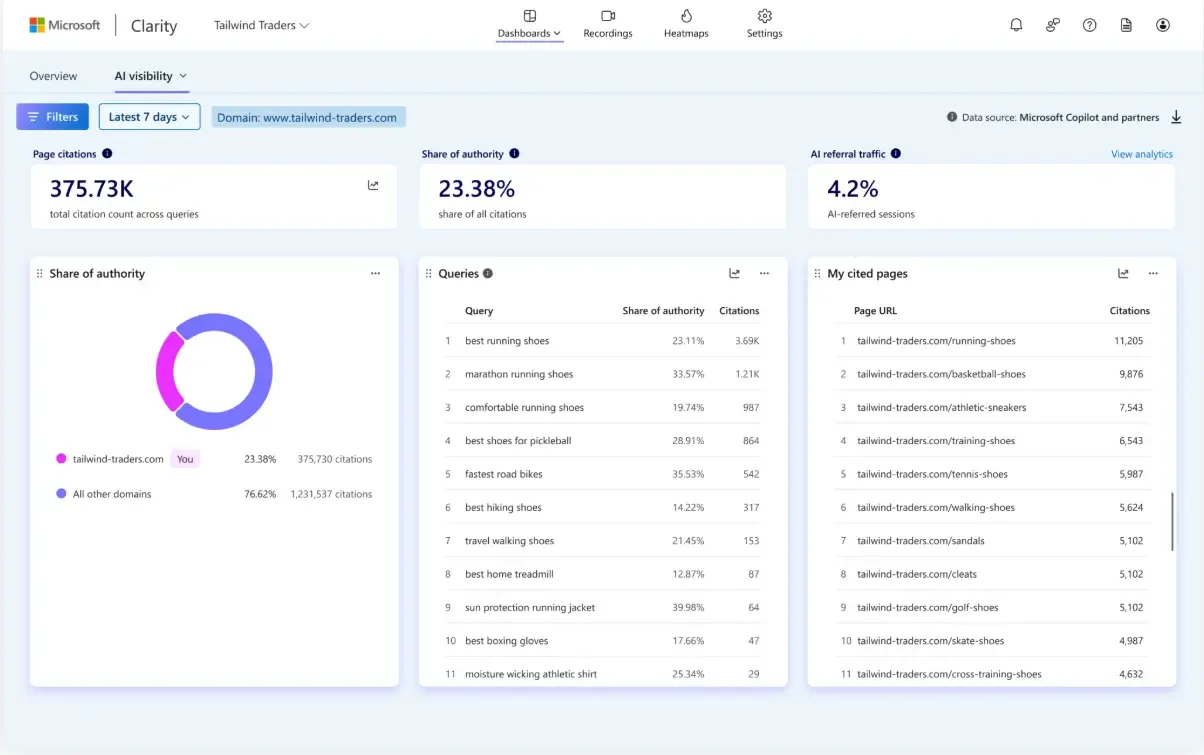
Microsoft Clarity's AI Citations feature is designed to help make some of that visibility measurable. Instead of focusing only on referral traffic, AI Citations tracks when your content is referenced or surfaced inside AI-generated responses. The feature gives website owners insight into which pages are being cited, which topics attract AI attention, and how AI visibility changes over time.
This introduces a completely different way of thinking about search performance.
For years, digital marketing revolved around a fairly simple relationship:
Visibility led to clicks
Clicks led to traffic
Traffic led to conversions
AI-powered discovery breaks that sequence apart.
A piece of content may influence thousands of AI-generated answers while producing only a fraction of the referral traffic traditional organic search once generated. In some cases, users get the answer they need directly inside an AI interface and never visit the source website at all.
That does not necessarily mean the content failed; it just means influence and traffic are no longer perfectly connected.
For SEO and content teams, this creates an entirely new category of measurement focused less on rankings alone and more on content visibility across AI ecosystems.
Which pages are AI systems citing most often? Which topics consistently appear in AI-generated answers? Which content formats seem to perform best inside retrieval systems?
Those are questions the industry is only beginning to understand. Clarity's AI Citations feature is one of the first attempts to bring that visibility into a mainstream analytics platform.
In a world increasingly shaped by AI-generated answers, that kind of visibility is probably going to matter a lot more than most people realize yet.
How Microsoft Clarity Collects Data
Under the hood, Microsoft Clarity works through a lightweight tracking script installed on your website.
Once the script is added, Clarity begins collecting behavioral interaction data automatically. That includes things like clicks, taps, scrolling behavior, mouse movement, page navigation, device type, and session activity across your site.
Importantly, the script runs asynchronously in the background, which means it does not block page rendering or noticeably slow down website performance. That is a big reason Clarity has become popular with marketers and developers who already have enough things competing for page speed budgets.
The platform then processes that behavioral data into:
Session recordings
Heatmaps
Frustration signals
Engagement insights
AI-generated summaries
One of Clarity's biggest advantages is that very little manual configuration is required.
You do not need to tag every button individually or spend hours building custom tracking events just to start seeing useful information. Most of the core functionality begins working automatically once the script is installed.
Microsoft Clarity also places a fairly heavy emphasis on privacy and data protection.
Sensitive information such as passwords, personal data fields, and other protected inputs is masked automatically by default. The platform is GDPR and CCPA compliant, and Microsoft does not sell collected user data to advertisers.
That said, website owners still need to think carefully about consent management, especially for visitors in regions with stricter privacy regulations like the EU, UK, and Switzerland.
This balance is part of why Clarity works so well as a modern analytics platform.
The barrier to entry is extremely low. Installation takes minutes. Data starts appearing quickly. Unlike a lot of enterprise analytics tools, you do not need a dedicated analyst just to extract something useful from it.
This is probably the simplest explanation for why Clarity spread so quickly in the first place.
Microsoft Clarity vs Google Analytics
Microsoft Clarity and Google Analytics are often compared to each other, but in practice, they solve very different problems.
Google Analytics is built primarily for quantitative analytics. It focuses on traffic, acquisition, conversions, audience segmentation, attribution, and reporting. It tells you how many people visited your website, where they came from, what pages they viewed, and whether they converted.
Microsoft Clarity focuses on behavioral analytics.
Instead of emphasizing traffic reports and dashboards, Clarity helps you understand how users actually experience your website after they arrive. It visualizes interaction patterns through session recordings, heatmaps, frustration signals, and behavioral insights.
The easiest way to think about the difference is this:
Google Analytics explains what happened
Microsoft Clarity helps explain why it happened
For example, Google Analytics may show that a landing page has a high bounce rate or unusually low conversions on mobile devices. Clarity helps uncover whether users were struggling with navigation, abandoning forms, rage-clicking broken elements, or simply never reaching important sections of the page.
The two platforms are far more complementary than competitive.
In fact, one of Clarity's strongest features is its direct Google Analytics integration, which allows teams to connect behavioral insights with traffic and conversion data in a much more meaningful way.
Here is the practical difference between the two platforms:
| Feature | Microsoft Clarity | Google Analytics |
| Primary focus | Behavioral analytics | Traffic & performance analytics |
| Session recordings | Yes | No |
| Heatmaps | Yes | No |
| Rage / dead click detection | Yes | No |
| AI-powered summaries | Yes | Limited |
| Traffic attribution | Basic | Advanced |
| Funnel analysis | Basic | Advanced |
| Cost | Free | Free / enterprise tiers |
Honestly, this is why so many teams end up using both.
Trying to use Google Analytics alone for behavioral analysis can feel like trying to solve a usability problem from inside a spreadsheet. The numbers tell you something went wrong, but they rarely show the actual experience that caused it. Clarity fills in that missing layer remarkably well.
Who Should Use Microsoft Clarity?
One of the reasons Microsoft Clarity became so widely adopted is that it solves problems for multiple teams at the same time.
Marketers
Marketers can use Clarity to understand how visitors interact with landing pages, campaign traffic, blog content, and conversion funnels. Instead of relying entirely on bounce rates and traffic reports, they can see where engagement drops off and where users lose momentum.
SEO Teams
SEO teams can use Clarity to analyze post-click behavior, identify weak content engagement, and uncover pages where users quickly abandon the experience despite strong rankings or traffic volume.
UX Designers
UX and product teams can use session recordings and heatmaps to identify usability issues, confusing layouts, dead zones, and mobile friction without needing formal user testing sessions for every iteration.
Developers
Developers can use Clarity to surface broken interactions, unresponsive elements, layout issues, and device-specific problems that may not appear during internal QA testing.
Ecommerce Teams
For ecommerce brands, Clarity is especially useful for analyzing cart abandonment, checkout friction, product page engagement, and mobile shopping behavior.
Because the platform is completely free, the barrier to experimenting with it is remarkably low compared to many traditional behavioral analytics platforms.
Is Microsoft Clarity Worth Using?
For most websites, yes. Microsoft Clarity manages to do something surprisingly rare in modern software: it is genuinely useful, genuinely powerful, and still genuinely free.
And more importantly, it solves a very real problem.
Most analytics platforms are great at reporting numbers. Clarity is great at exposing behavior. It helps you understand why users get frustrated, where they lose momentum, what they ignore, and what quietly pushes them away from converting altogether.
That kind of visibility is difficult to fake and even harder to replace once you start using it regularly.
The platform is also remarkably accessible. Setup takes minutes, most features work automatically, and you do not need a dedicated analytics team just to extract something useful from the data. Whether you are running a content site, SaaS product, ecommerce store, or marketing campaign, Clarity makes it much easier to see your website the way real users actually experience it.
And increasingly, the way AI systems experience it too.
That combination of behavioral analytics, AI visibility, session recordings, heatmaps, and frustration tracking makes Clarity one of the more interesting analytics platforms available right now, especially considering Microsoft still offers the entire thing for free.
Which still feels slightly suspicious in the current SaaS economy.
If you want more breakdowns on SEO, AI visibility, behavioral analytics, and how search is changing in 2026 and beyond, subscribe to the Shop Talk newsletter for weekly insights, strategy deep dives, and practical marketing analysis without the usual recycled growth-hack nonsense.
And if you are trying to figure out how all of this applies to your own website, contact us. We are happy to help.